Best Franchise Opportunities in San Diego, California, According to Our Study
Compare 13 franchise concepts in San Diego and see how Naval Base San Diego — 60 ships, 250 tenant commands, 26,000 sailors, 6,000 reservists, and 30,000...
What “best” means in this rankingBest means the franchise opportunities scoring highest in our San Diego study. The study does not estimate earning potential or determine which franchise is right for you. It does not estimate earnings or determine which franchise is best for a particular candidate.
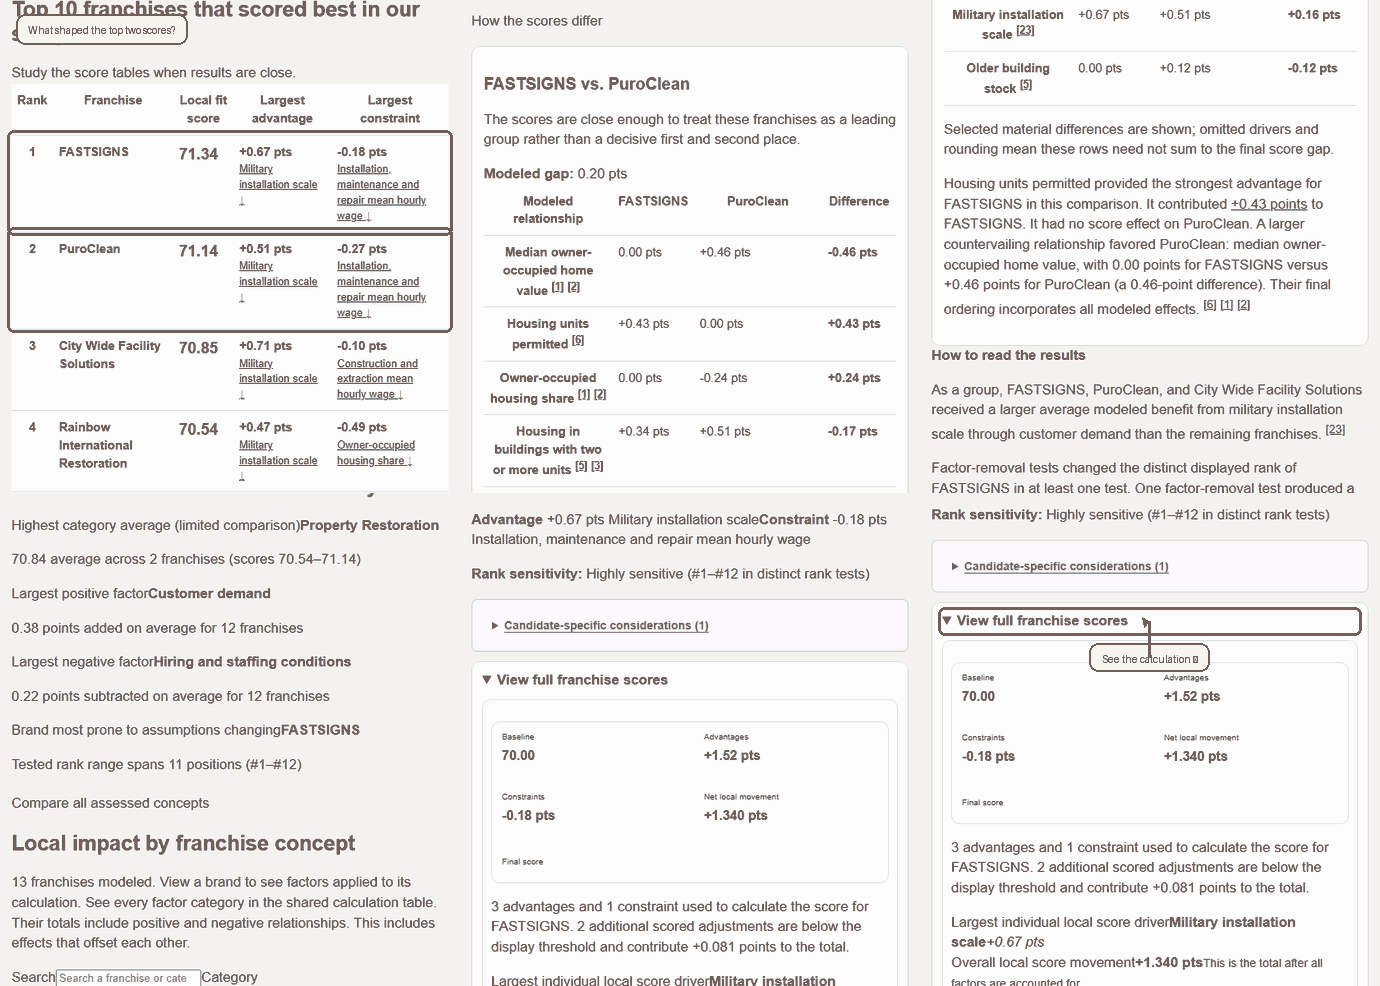
FASTSIGNS ranks first among the franchise opportunities assessed for San Diego, California, 0.20 points ahead of PuroClean
We compared 13 franchise concepts against San Diego's modeled operating realities.Naval Base San Diego reports 60 ships, 250 tenant commands, 26,000 sailors, 6,000 reservists, and 30,000 civilian personnel. This created one of the strongest positive local signals for concepts whose operating models are sensitive to defense-linked institutional demand. [23]Owner-occupied housing share created one of the more important local constraints for concepts whose operating models are sensitive to the city's lower owner-occupancy rate. [1][2]
FASTSIGNS scored 71.34.FASTSIGNS, PuroClean, and City Wide Facility Solutions received the highest scores of 71.34, 71.14, and 70.85 among the 13 franchise opportunities assessed under San Diego, California operating conditions.Naval Base San Diego reports 60 ships, 250 tenant commands, 26,000 sailors, 6,000 reservists, and 30,000 civilian personnel. This was the largest positive effect for FASTSIGNS and added 0.67 points through defense-linked institutional demand. [23]Across the San Diego-Chula Vista-Carlsbad MSA, the mean wage for installation, maintenance and repair occupations was $33.23/hour in May 2025. This was the largest negative effect for FASTSIGNS and lowered its score by 0.18 points through higher local labor costs. [8]Between the two, the strongest modeled relationship favoring FASTSIGNS over PuroClean came from housing units permitted. It contributed +0.43 points to FASTSIGNS' score. It had no score effect on PuroClean. A larger countervailing relationship favored PuroClean: median owner-occupied home value, with 0.00 points for FASTSIGNS versus +0.46 points for PuroClean (a 0.46-point difference). Their final ordering incorporates all modeled effects. [6][1][2]
Evidence assessed
Local reality: Naval Base San Diego reports 60 ships, 250 tenant commands, 26,000 sailors, 6,000 reservists, and 30,000 civilian personnel. [23]
Impact on our study: In the model, FASTSIGNS benefits from institutional demand tied to a defense-heavy local economy. The operating assumption used here is: Targets institutions or large commercial accounts.
Modeled consequence: The model assigned +0.67 points through defense-linked institutional demand.
What this means: this is a modeled study of documented local conditions against franchise-specific operating assumptions. It is not an investment recommendation.
A city condition changes a franchise score only when it intersects with a relevant operating-model exposure. The center shows average effect when applied; the surrounding ring shows how broadly that relationship reached across the concepts assessed.
Selected material differences are shown; omitted drivers and rounding mean these rows need not sum to the final score gap.
Housing units permitted provided the strongest advantage for FASTSIGNS in this comparison. It contributed +0.43 points to FASTSIGNS. It had no score effect on PuroClean. A larger countervailing relationship favored PuroClean: median owner-occupied home value, with 0.00 points for FASTSIGNS versus +0.46 points for PuroClean (a 0.46-point difference). Their final ordering incorporates all modeled effects. [6][1][2]
How to read the results
As a group, FASTSIGNS, PuroClean, and City Wide Facility Solutions received a larger average modeled benefit from military installation scale through customer demand than the remaining franchises. [23]
Factor-removal tests changed the distinct displayed rank of FASTSIGNS in at least one test. One factor-removal test produced a displayed-score tie, which does not establish a unique rank within that tied group.
Contribution path
Contribution path for FASTSIGNS
Baseline70.00→Final71.34Net change+1.34 pts
Scored local driverRelationship effectScore after driver
Military installation scale [23]Defense/aerospace economic concentration
+0.67 pts
70.67
Housing units permitted [6]Construction and renovation activity
+0.43 pts
71.09
Housing in buildings with two or more units [5][3]Multifamily housing concentration
+0.34 pts
71.44
Installation, maintenance and repair mean hourly wage [8]High local occupational wage cost environment
-0.18 pts
71.26
Other modeled adjustments below the display threshold
City-specific methodology views that change only when the selected city evidence or analytical workflow materially changes.
Inside the San Diego calculationsHow one San Diego factor is modeledFactor distribution
13Franchises evaluated
52Local sources used
44Primary local sources
77Local metrics
Evaluation set
Why these franchises?
This is not an exhaustive list of available franchises.
13Brands evaluated
We included brands with enough operating or public information to build scoring models, using materials from various sources.
Unresolved inputs may reduce confidence or remain conditional until their applicability is established.
Pipeline Franchises working with a brand does not add points in the analysis.
Study conclusions
Notable observations from our study
Highest category average (limited comparison)Property Restoration
70.84 average across 2 franchises (scores 70.54–71.14)
Largest positive factorCustomer demand
0.38 points added on average for 12 franchises
Largest negative factorHiring and staffing conditions
0.22 points subtracted on average for 12 franchises
Brand most prone to assumptions changingFASTSIGNS
Tested rank range spans 11 positions (#1–#12)
Compare all assessed concepts
Local impact by franchise concept
13 franchises modeled. View a brand to see factors applied to its calculation. See every factor category in the shared calculation table. Their totals include positive and negative relationships. This includes effects that offset each other.
Full score ledger
Scroll across to compare franchises. Select a score contribution to inspect its calculation and evidence.
+Positive scored effect−Negative scored effect=Measured; no meaningful local adjustment—Not included in the scoreiContext only; not included in the score◇Candidate-dependent; not included in the score×Not applicable to this operating model?Not available○No material operating exposure resolved=No material score adjustment
Full score ledger
Score component
#1FASTSIGNS71.34
#2PuroClean71.14
#3City Wide Facility Solutions70.85
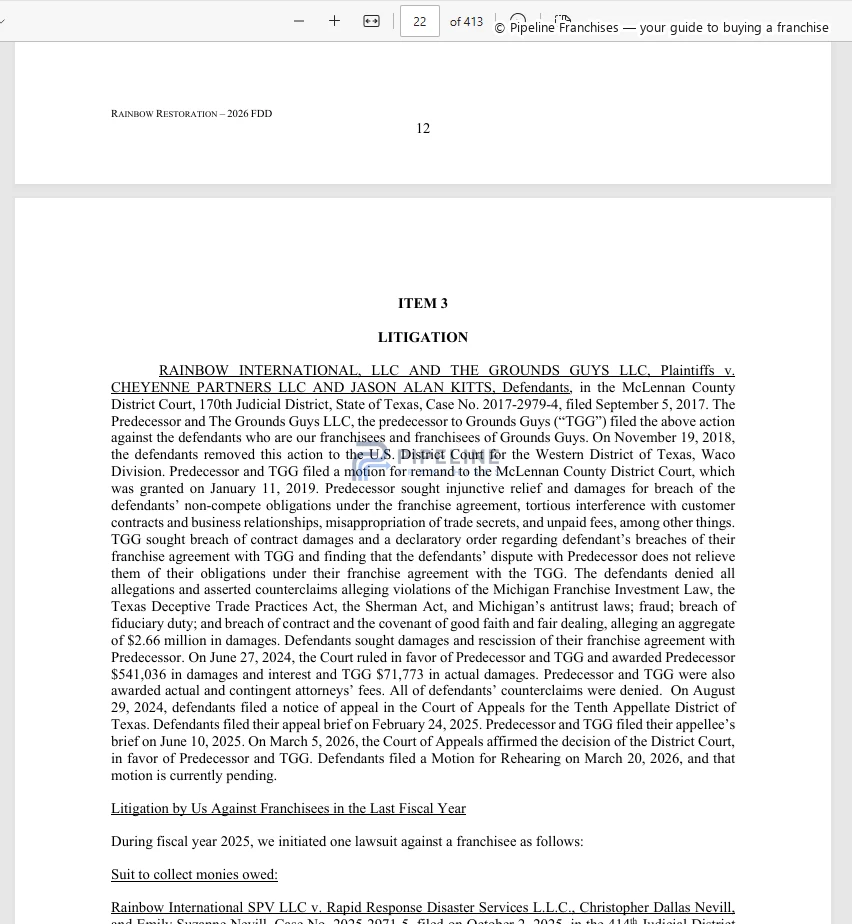
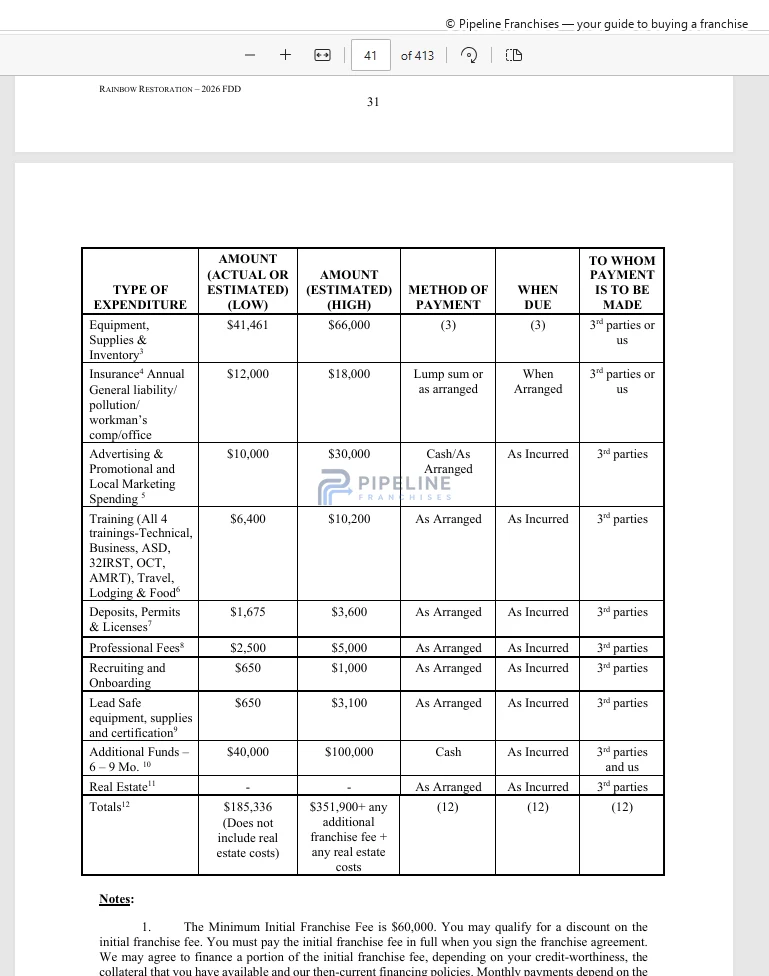
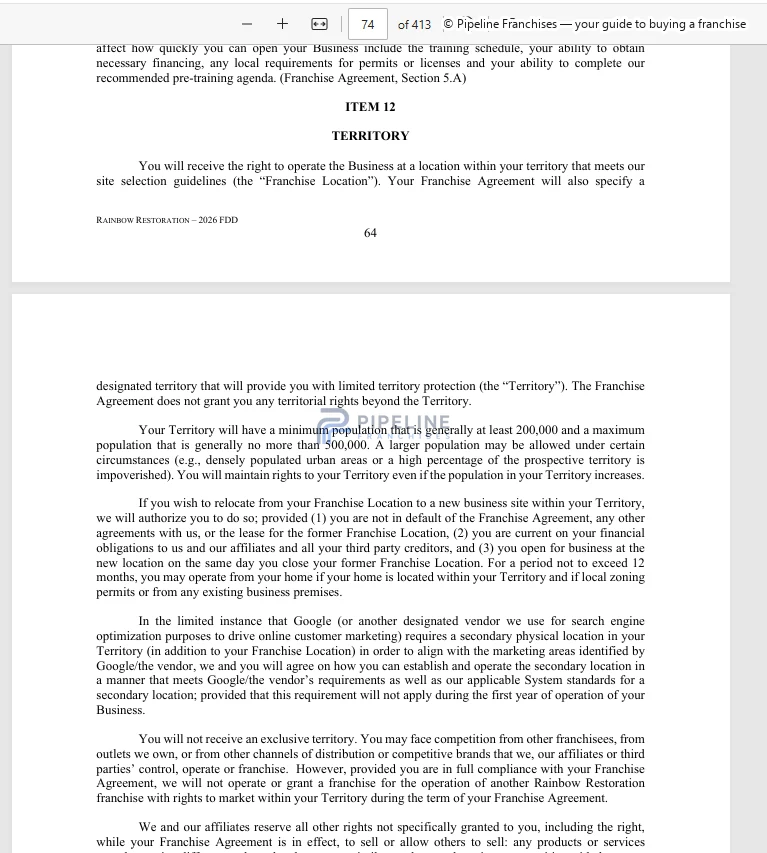
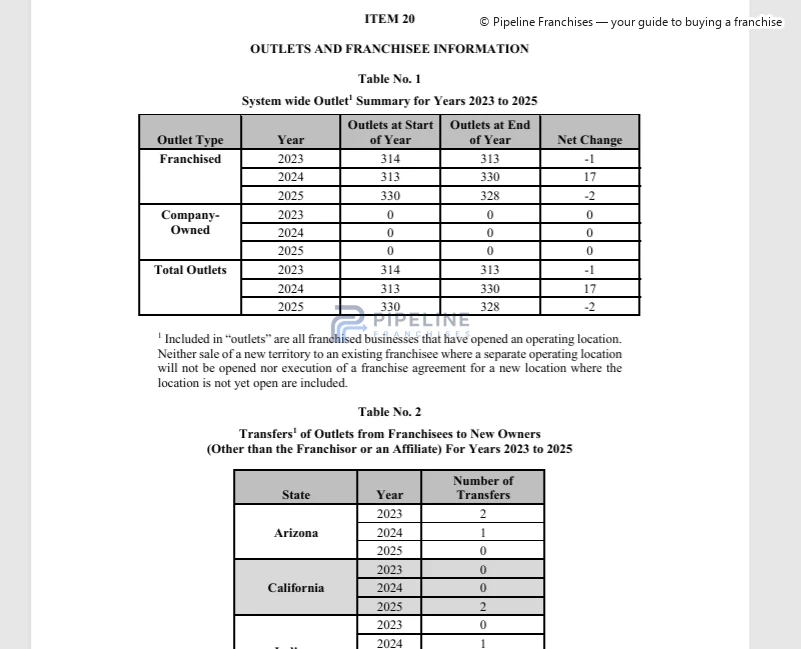
#4Rainbow International Restoration70.54
#5Aire Serv70.30
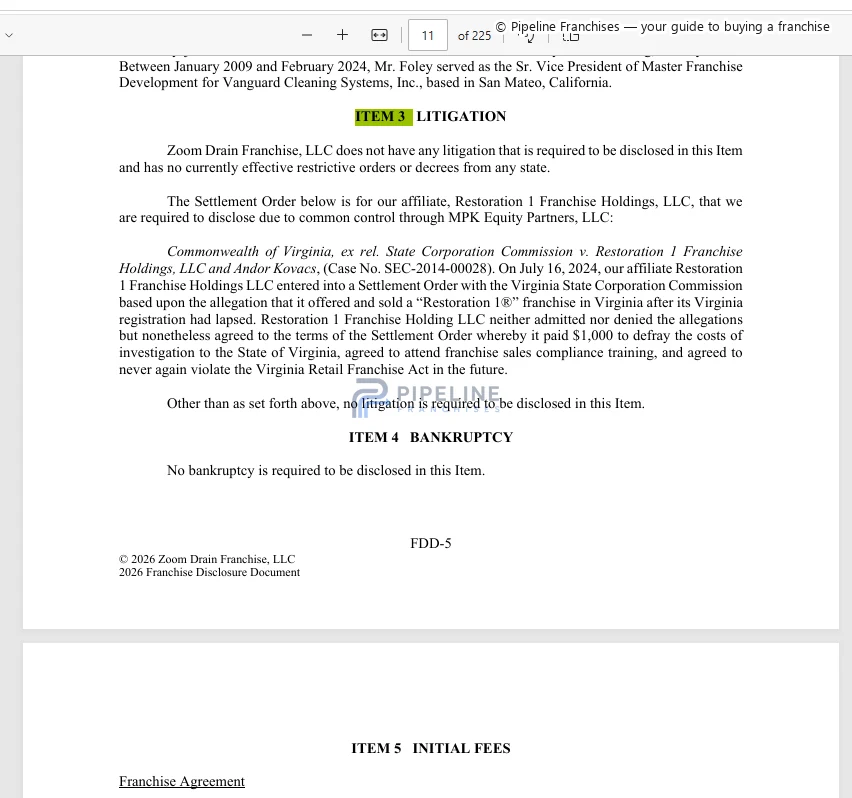
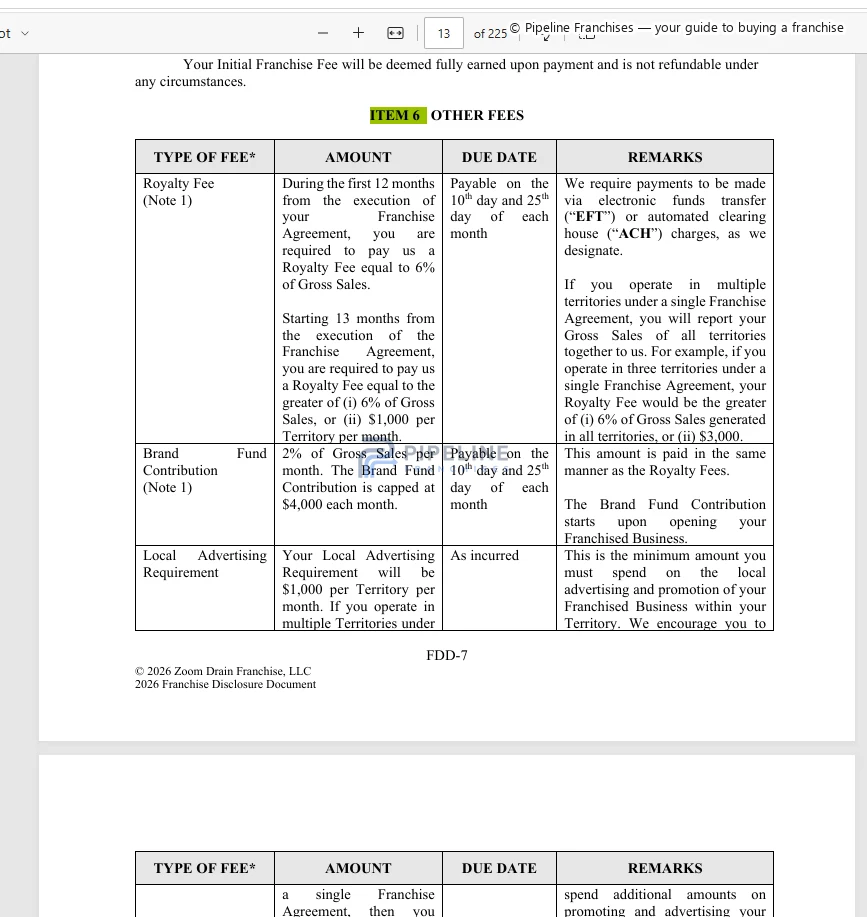
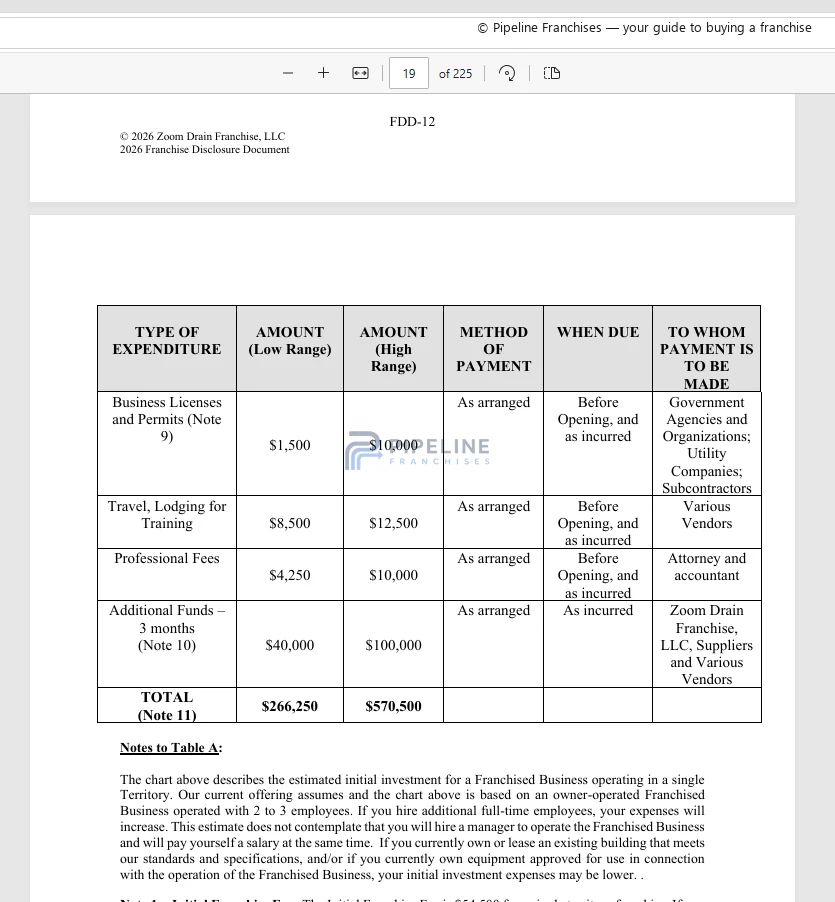
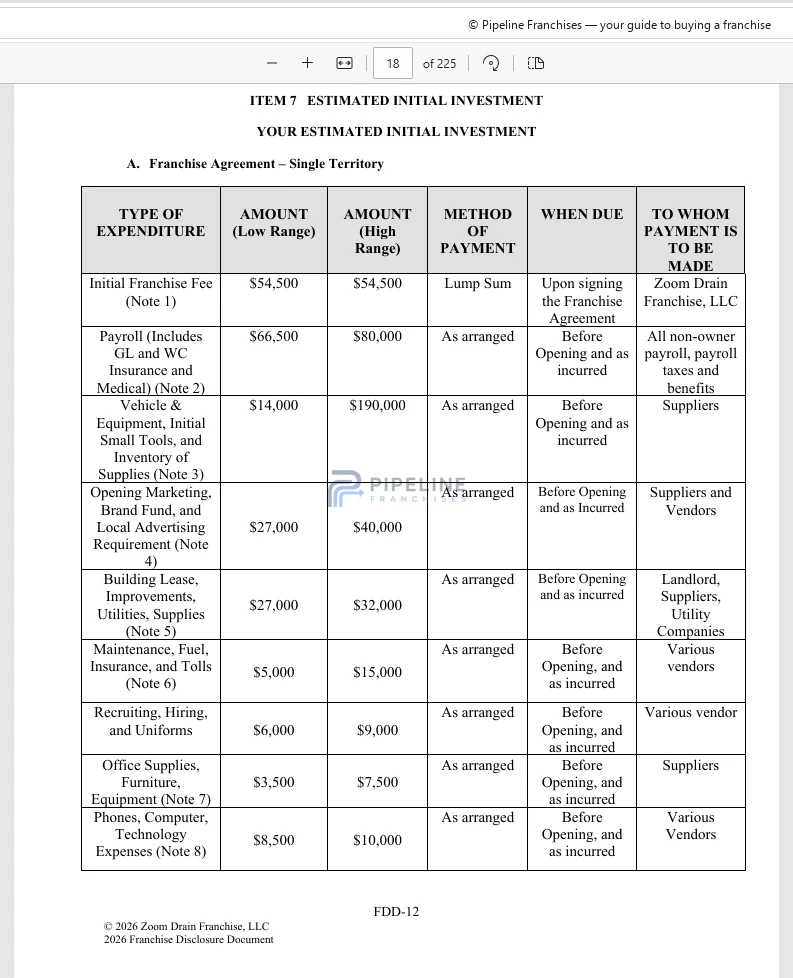
#6ZOOM DRAIN70.29
#7ActionCOACH70.10
#8Pillar To Post Home Inspectors70.09
#9Mr. Rooter70.03
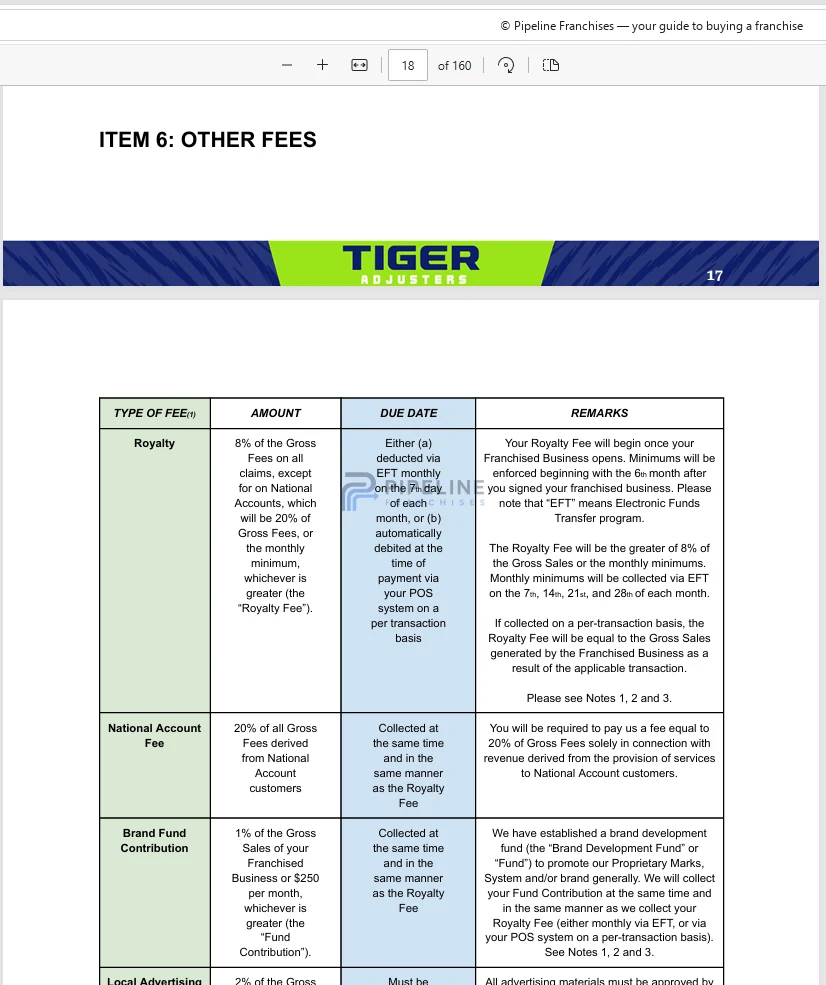
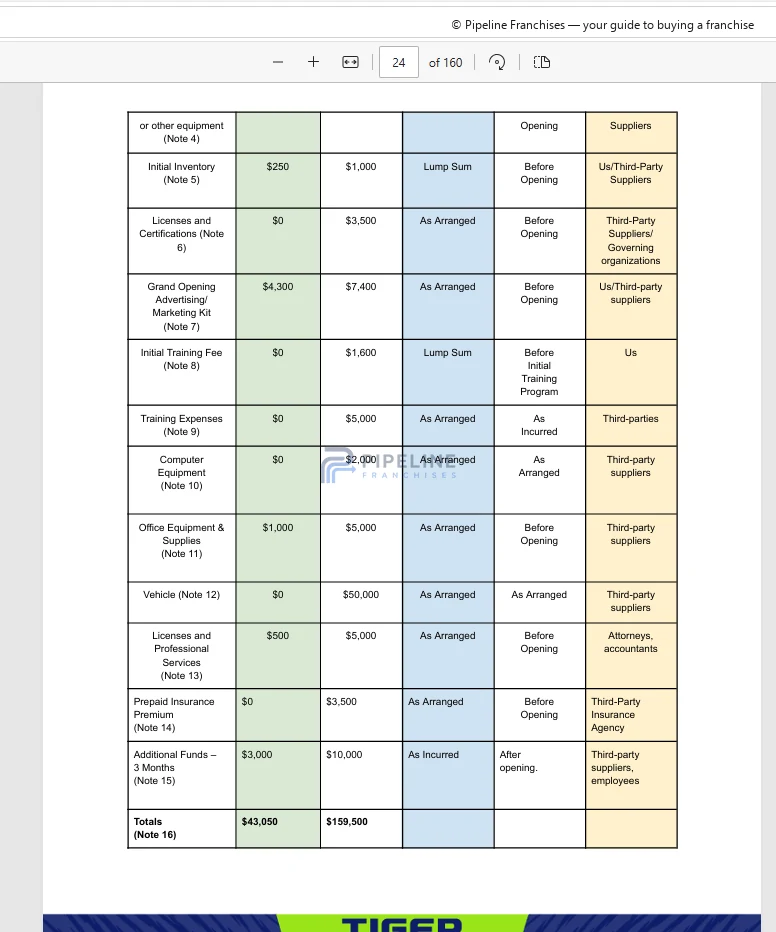
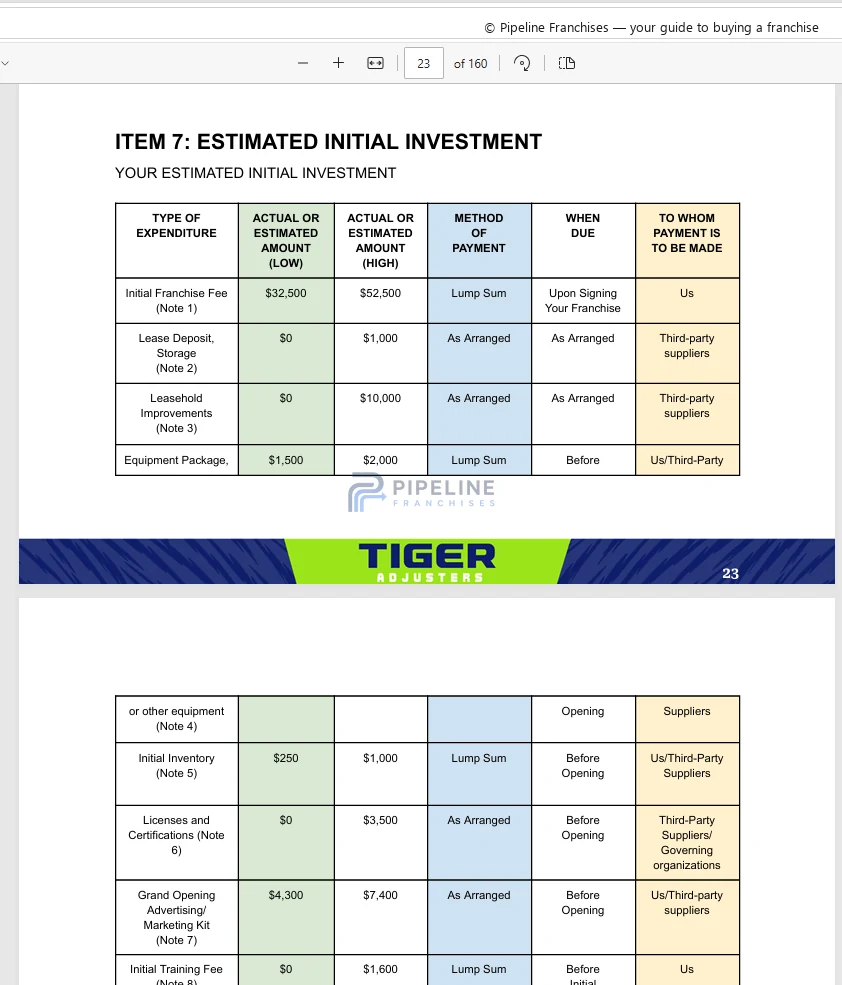
#10Tiger Adjusters69.86
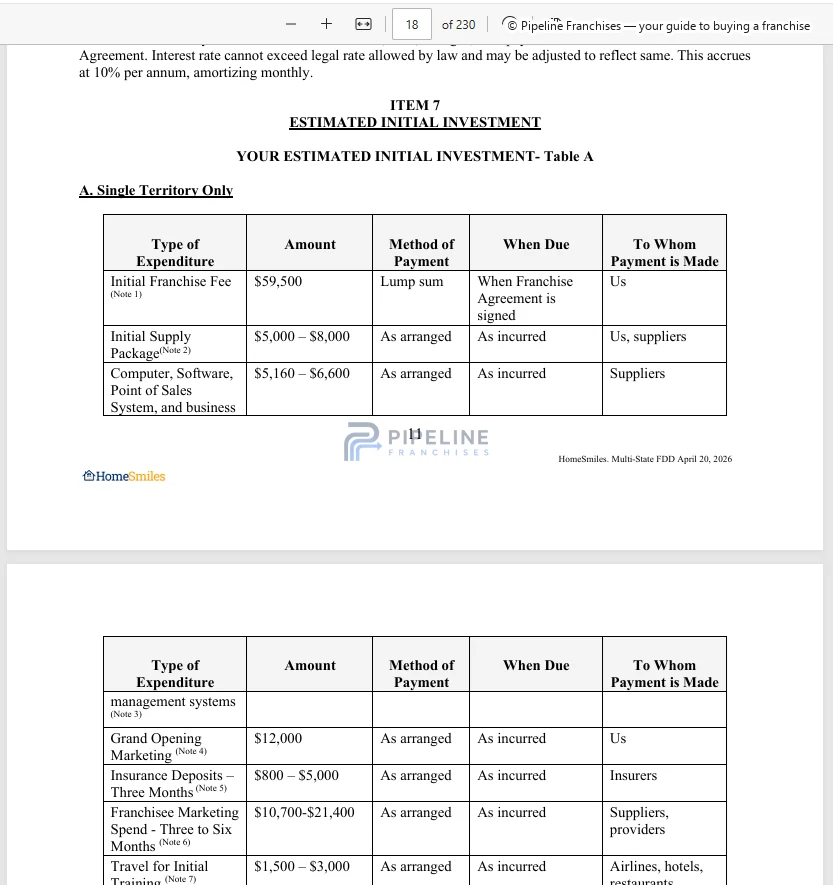
#11HomeSmiles69.76
#12Mister Sparky Electric69.69
#13Workout Anytime67.73
Neutral model baseline
70.00
70.00
70.00
70.00
70.00
70.00
70.00
70.00
70.00
70.00
70.00
70.00
70.00
Median gross rentHousing costs squeezing gym-membership spendingSan Diego city, California
Military installation scaleDefense/aerospace economic concentrationNaval Base San Diego
+0.67
Largest driverRelationship test: Rank stays #1 without this driver.Evidence confidence: HighSource[23]
Local observationMilitary installation scale60 ships, 250 tenant commands, 26,000 sailors, 6,000 reservists, and 30,000 civilian personnelNaval Base San DiegoCurrent 2026
Largest driverRelationship test: Rank stays #2 without this driver.Evidence confidence: HighSource[23]
Local observationMilitary installation scale60 ships, 250 tenant commands, 26,000 sailors, 6,000 reservists, and 30,000 civilian personnelNaval Base San DiegoCurrent 2026
Largest driverRelationship test: Rank stays #3 without this driver.Evidence confidence: HighSource[23]
Local observationMilitary installation scale60 ships, 250 tenant commands, 26,000 sailors, 6,000 reservists, and 30,000 civilian personnelNaval Base San DiegoCurrent 2026
Local observationMilitary installation scale60 ships, 250 tenant commands, 26,000 sailors, 6,000 reservists, and 30,000 civilian personnelNaval Base San DiegoCurrent 2026
Local observationMilitary installation scale60 ships, 250 tenant commands, 26,000 sailors, 6,000 reservists, and 30,000 civilian personnelNaval Base San DiegoCurrent 2026
Largest driverRelationship test: Rank #7 to #8 without this driver.Evidence confidence: HighSource[23]
Local observationMilitary installation scale60 ships, 250 tenant commands, 26,000 sailors, 6,000 reservists, and 30,000 civilian personnelNaval Base San DiegoCurrent 2026
Local observationMilitary installation scale60 ships, 250 tenant commands, 26,000 sailors, 6,000 reservists, and 30,000 civilian personnelNaval Base San DiegoCurrent 2026
Local observationMilitary installation scale60 ships, 250 tenant commands, 26,000 sailors, 6,000 reservists, and 30,000 civilian personnelNaval Base San DiegoCurrent 2026
Local observationWater rate increase effective January 1, 202614.7%City of San Diego Public Utilities water service area2026
Operating relationshipBroad utility-rate pressure
Calculation controls
Relationship maximum
3
City-condition strength
0.25
Operating exposure
0.3462
Evidence confidence
1
Provenance multiplier
1
Geographic applicability
1
Profile effect multiplier
0.9775
Eligibility weight
1
Effect before model controls
-0.253774
Final effect
-0.126887
Single-relationship cap
1
Modifier cap
1
Correlation control
0.5
Effect-family cap
1
Factor cap
1
Total local-movement cap
1
Model adjustmentNot local evidence
-0.10
Model adjustmentNot local evidenceCalculation controls
Relationship maximum
0.1
City-condition strength
1
Operating exposure
1
Evidence confidence
1
Provenance multiplier
1
Geographic applicability
1
Profile effect multiplier
1
Eligibility weight
1
Effect before model controls
-0.1
Final effect
-0.1
Single-relationship cap
1
Modifier cap
1
Correlation control
1
Effect-family cap
1
Factor cap
1
Total local-movement cap
1
Local rules and operating requirements — Factor subtotal
-0.10
-0.13
-1.54
Advantages
+1.52
+1.66
+0.95
+1.30
+1.52
+1.50
+0.20
+1.10
+1.33
+0.66
+1.00
+1.07
+0.16
Constraints
-0.18
-0.52
-0.10
-0.76
-1.23
-1.21
-0.10
-1.02
-1.30
-0.79
-1.24
-1.38
-2.43
Net local movement
+1.340
+1.141
+0.850
+0.542
+0.296
+0.287
+0.096
+0.085
+0.028
-0.138
-0.237
-0.314
-2.270
Full-precision calculated score
71.339542
71.140546
70.849947
70.542239
70.295544
70.286771
70.096350
70.085290
70.027648
69.861574
69.763100
69.686232
67.730194
Published local fit
71.34
71.14
70.85
70.54
70.30
70.29
70.10
70.09
70.03
69.86
69.76
69.69
67.73
Factor calculations use full precision. Factor totals and published scores are displayed to two decimal places; ranking order uses the full-precision score.
#171.34
FASTSIGNS
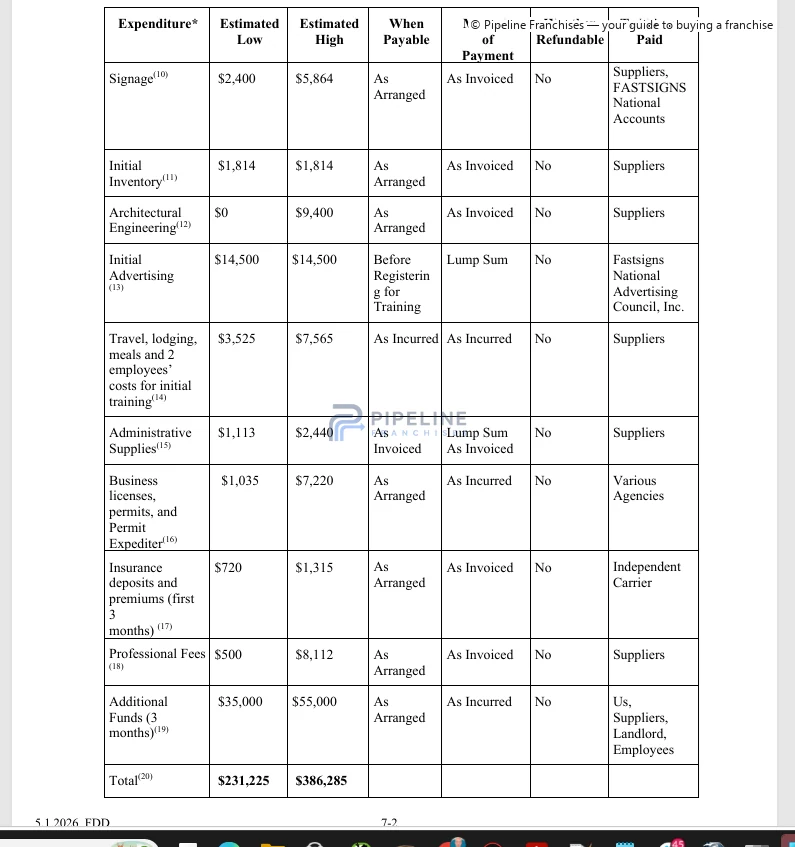
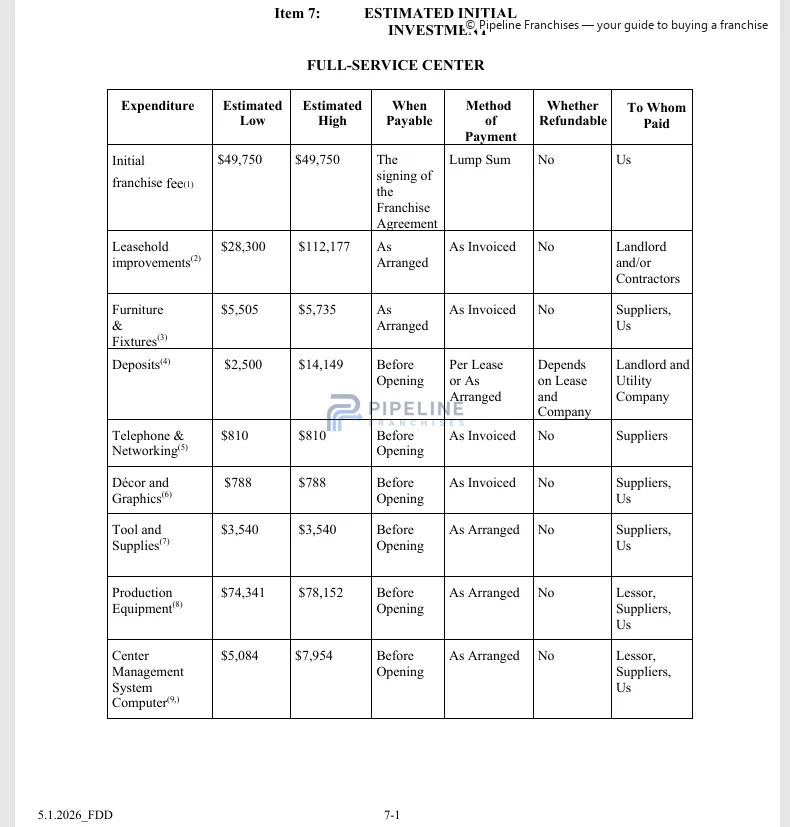
Initial investment: $231,226–$386,285
Advantage +0.67 pts Military installation scaleConstraint -0.18 pts Installation, maintenance and repair mean hourly wage
Rank sensitivity: Highly sensitive (#1–#12 in distinct rank tests)
Candidate-specific considerations (1)
Not included in this score
Potential candidate constraint
Institutional procurement and vendor-onboarding friction
Referral channels
Evidence confidence: HighSource[35][36]San Diego institutional procurement environment
Operating relationshipInstitutional procurement and vendor-onboarding friction
City and port bidder enrollment only apply when pursuing those institutional contracts
View full franchise scores
Baseline70.00
Advantages+1.52 pts
Constraints-0.18 pts
Net local movement+1.340 pts
Final score71.34
3 advantages and 1 constraint used to calculate the score for FASTSIGNS. 2 additional scored adjustments are below the display threshold and contribute +0.081 points to the total.
Largest individual local score driverMilitary installation scale+0.67 pts
Overall local score movement+1.340 ptsThis is the total after all factors are accounted for.
Applicability depends on the selected neighborhood
View full franchise scores
Baseline70.00
Advantages+1.66 pts
Constraints-0.52 pts
Net local movement+1.141 pts
Final score71.14
4 advantages and 2 constraints used to calculate the score for PuroClean. 2 additional scored adjustments are below the display threshold and contribute +0.055 points to the total.
Largest individual local score driverMilitary installation scale+0.51 pts
Overall local score movement+1.141 ptsThis is the total after all factors are accounted for.
Advantage +0.71 pts Military installation scaleConstraint -0.10 pts Construction and extraction mean hourly wage
Rank sensitivity: Stable (#3–#3 in distinct rank tests; 1 display-tied test separately)
Candidate-specific considerations (1)
Not included in this score
Potential candidate constraint
Institutional procurement and vendor-onboarding friction
Referral channels
Evidence confidence: HighSource[35][36]San Diego institutional procurement environment
Operating relationshipInstitutional procurement and vendor-onboarding friction
City and port bidder enrollment only apply when pursuing those institutional contracts
View full franchise scores
Baseline70.00
Advantages+0.95 pts
Constraints-0.10 pts
Net local movement+0.850 pts
Final score70.85
3 advantages and 1 constraint used to calculate the score for City Wide Facility Solutions. 2 additional scored adjustments are below the display threshold and contribute +0.058 points to the total.
Largest individual local score driverMilitary installation scale+0.71 pts
Overall local score movement+0.850 ptsThis is the total after all factors are accounted for.
Rank sensitivity: Stable (#4–#4 in distinct rank tests; 1 display-tied test separately)
Candidate-specific considerations (6)
Not included in this score
Potential candidate advantage
Mapped flood or coastal flood exposure
Repair and replacement demand
Evidence confidence: HighSource[28]FEMA Special Flood Hazard Areas in San Diego
Operating relationshipMapped flood or coastal flood exposure
Applicability depends on the selected floodplain
Potential candidate advantage
Wildfire and defensible-space exposure
Repair and replacement demand
Evidence confidence: HighSource[27]City of San Diego Very High Fire Hazard Severity Zones
Operating relationshipWildfire and defensible-space exposure
Applicability depends on the selected wildfire zone
Potential candidate constraint
Pure Water San Diego Phase 1 — Corridor or highway construction disruption
Driving, routing, and parking
Evidence confidence: HighSource[38]Eastgate Mall / Miramar Pure Water construction corridor
Operating relationshipShort-term driving and routing disruption
Applicability depends on the selected corridor
Potential candidate constraint
Commercial-vehicle route or access restrictions
Driving, routing, and parking
Evidence confidence: HighSource[31]San Diego communities south of downtown
Operating relationshipCommercial-vehicle route or access restrictions
Applicability depends on the selected district
Potential candidate constraint
Institutional procurement and vendor-onboarding friction
Referral channels
Evidence confidence: HighSource[35][36]San Diego institutional procurement environment
Operating relationshipInstitutional procurement and vendor-onboarding friction
City and port bidder enrollment only apply when pursuing those institutional contracts
Potential candidate advantage
PHCC San Diego — Contractor and trade referral channels
Referral channels
Evidence confidence: ModerateSource[49]PHCC San Diego trade network
Operating relationshipContractor and trade referral channels
Applicability depends on the selected submarket
View full franchise scores
Baseline70.00
Advantages+1.30 pts
Constraints-0.76 pts
Net local movement+0.542 pts
Final score70.54
4 advantages and 2 constraints used to calculate the score for Rainbow International Restoration. 2 additional scored adjustments are below the display threshold and contribute +0.054 points to the total.
Largest individual local score driverOwner-occupied housing share-0.49 pts
Overall local score movement+0.542 ptsThis is the total after all factors are accounted for.
Applicability depends on the selected neighborhood
View full franchise scores
Baseline70.00
Advantages+1.52 pts
Constraints-1.23 pts
Net local movement+0.296 pts
Final score70.30
6 advantages and 3 constraints used to calculate the score for Aire Serv. 2 additional scored adjustments are below the display threshold and contribute +0.042 points to the total.
Largest individual local score driverOwner-occupied housing share-0.73 pts
Overall local score movement+0.296 ptsThis is the total after all factors are accounted for.
Advantage +0.37 pts Median owner-occupied home valueConstraint -0.72 pts Owner-occupied housing share
Rank sensitivity: Stable (#5–#6 in distinct rank tests; 1 display-tied test separately)
Candidate-specific considerations (3)
Not included in this score
Potential candidate constraint
Pure Water San Diego Phase 1 — Corridor or highway construction disruption
Driving, routing, and parking
Evidence confidence: HighSource[38]Eastgate Mall / Miramar Pure Water construction corridor
Operating relationshipShort-term driving and routing disruption
Applicability depends on the selected corridor
Potential candidate constraint
Commercial-vehicle route or access restrictions
Driving, routing, and parking
Evidence confidence: HighSource[31]San Diego communities south of downtown
Operating relationshipCommercial-vehicle route or access restrictions
Applicability depends on the selected district
Potential candidate advantage
PHCC San Diego — Contractor and trade referral channels
Referral channels
Evidence confidence: ModerateSource[49]PHCC San Diego trade network
Operating relationshipContractor and trade referral channels
Applicability depends on the selected submarket
View full franchise scores
Baseline70.00
Advantages+1.50 pts
Constraints-1.21 pts
Net local movement+0.287 pts
Final score70.29
7 advantages and 3 constraints used to calculate the score for ZOOM DRAIN. 4 additional scored adjustments are below the display threshold and contribute +0.074 points to the total.
Largest individual local score driverOwner-occupied housing share-0.72 pts
Overall local score movement+0.287 ptsThis is the total after all factors are accounted for.
Applicability depends on the selected neighborhood
View full franchise scores
Baseline70.00
Advantages+1.33 pts
Constraints-1.30 pts
Net local movement+0.028 pts
Final score70.03
5 advantages and 3 constraints used to calculate the score for Mr. Rooter. 1 additional scored adjustment is below the display threshold and contributes +0.016 points to the total.
Largest individual local score driverOwner-occupied housing share-0.72 pts
Overall local score movement+0.028 ptsThis is the total after all factors are accounted for.
Advantage +0.40 pts Median owner-occupied home valueConstraint -0.65 pts Owner-occupied housing share
Rank sensitivity: Stable (#10–#11 in distinct rank tests; 1 display-tied test separately)
Candidate-specific considerations (1)
Not included in this score
Potential candidate advantage
PHCC San Diego — Contractor and trade referral channels
Referral channels
Evidence confidence: ModerateSource[49]PHCC San Diego trade network
Operating relationshipContractor and trade referral channels
Applicability depends on the selected submarket
View full franchise scores
Baseline70.00
Advantages+0.66 pts
Constraints-0.79 pts
Net local movement-0.138 pts
Final score69.86
3 advantages and 2 constraints used to calculate the score for Tiger Adjusters. 1 additional scored adjustment is below the display threshold and contributes +0.027 points to the total.
Largest individual local score driverOwner-occupied housing share-0.65 pts
Overall local score movement-0.138 ptsThis is the total after all factors are accounted for.
Rank sensitivity: Moderately sensitive (#10–#12 in distinct rank tests; 1 display-tied test separately)
Candidate-specific considerations (1)
Not included in this score
Potential candidate constraint
Commercial-vehicle route or access restrictions
Driving, routing, and parking
Evidence confidence: HighSource[31]San Diego communities south of downtown
Operating relationshipCommercial-vehicle route or access restrictions
Applicability depends on the selected district
View full franchise scores
Baseline70.00
Advantages+1.00 pts
Constraints-1.24 pts
Net local movement-0.237 pts
Final score69.76
4 advantages and 3 constraints used to calculate the score for HomeSmiles. 2 additional scored adjustments are below the display threshold and contribute +0.079 points to the total.
Largest individual local score driverOwner-occupied housing share-0.80 pts
Overall local score movement-0.237 ptsThis is the total after all factors are accounted for.
Advantage +0.31 pts Median owner-occupied home valueConstraint -0.89 pts Owner-occupied housing share
Rank sensitivity: Highly sensitive (#1–#12 in distinct rank tests)
Candidate-specific considerations (1)
Not included in this score
Potential candidate constraint
Pure Water San Diego Phase 1 — Corridor or highway construction disruption
Driving, routing, and parking
Evidence confidence: HighSource[38]Eastgate Mall / Miramar Pure Water construction corridor
Operating relationshipShort-term driving and routing disruption
Applicability depends on the selected corridor
View full franchise scores
Baseline70.00
Advantages+1.07 pts
Constraints-1.38 pts
Net local movement-0.314 pts
Final score69.69
5 advantages and 3 constraints used to calculate the score for Mister Sparky Electric. 1 additional scored adjustment is below the display threshold and contributes +0.010 points to the total.
Largest individual local score driverOwner-occupied housing share-0.89 pts
Overall local score movement-0.314 ptsThis is the total after all factors are accounted for.
We removed one factor category at a time, recalculated everything, and measured movements.
Observed model effectMixed or model dependent
Customer demand
We tested how much of the city’s potential customer and business demand remained after accounting for operating challenges.
Why concepts react differently
We modeled a measurable customer demand impact on 12 of the 13 franchises in San Diego. Removing the entire customer demand category changed the ranks of 9 franchises. FASTSIGNS moved from #1 to #12, tied for the largest rank change among franchises directly affected by this category.
Concepts adjusted12 of 13
Average among affected+0.38 pts
Average across all concepts+0.36 pts
Concepts changing rank9
What we observed
Population Change Since 20201.6%
Owner Occupied Housing Share47.3%
Housing Units Permitted8,782 housing units
Concepts helped most
FASTSIGNSSigns & Graphics
+1.52 pts
PuroCleanProperty Restoration
+1.29 pts
City Wide Facility SolutionsIntegrated Facility Management
+0.95 pts
Rainbow International RestorationProperty Restoration
+0.69 pts
ZOOM DRAINPlumbing & Drain Services
+0.52 pts
Concepts challenged most
Workout AnytimeFull-Service Fitness
-0.83 pts
Mister Sparky ElectricElectrical Services
-0.33 pts
HomeSmilesRecurring Property Maintenance
-0.21 pts
Observed model effectMixed or model dependent
Repair and replacement demand
We compared the age and condition of relevant property systems with the services each concept is actually equipped to provide.
Why concepts react differently
We modeled a measurable repair and replacement demand impact on 7 of the 13 franchises in San Diego. Removing the entire repair and replacement demand category changed the ranks of 4 franchises. Aire Serv moved from #5 to #8, the largest rank change among franchises directly affected by this category.
Concepts adjusted7 of 13
Average among affected+0.21 pts
Average across all concepts+0.11 pts
Concepts changing rank4
What we observed
Commercial Building Benchmarking Size Threshold50 thousand square feet
Annual Building Energy Benchmarking Filing DeadlineJune 1 annually
Median Year Built1978
Concepts helped most
Aire ServHVAC
+0.40 pts
Mister Sparky ElectricElectrical Services
+0.36 pts
ZOOM DRAINPlumbing & Drain Services
+0.16 pts
Mr. RooterPlumbing & Drain Services
+0.16 pts
Pillar To Post Home InspectorsHome Inspection
+0.15 pts
Observed model effectMixed or model dependent
Hiring and staffing conditions
We compared each concept’s frontline and specialist staffing requirements with the local labor environment.
Why concepts react differently
We modeled a measurable hiring and staffing conditions impact on 12 of the 13 franchises in San Diego. Removing the entire hiring and staffing conditions category changed the ranks of 5 franchises. Mr. Rooter moved from #9 to #7, tied for the largest rank change among franchises directly affected by this category.
Concepts adjusted12 of 13
Average among affected-0.22 pts
Average across all concepts-0.20 pts
Concepts changing rank5
What we observed
Food Preparation And Serving Mean Hourly Wage$21.26/hour
Mean Hourly Wage For Building And Grounds Occupations$21.92/hour
Office And Administrative Support Mean Hourly Wage$27.84/hour
Concepts helped most
Workout AnytimeFull-Service Fitness
+0.10 pts
HomeSmilesRecurring Property Maintenance
+0.10 pts
Concepts challenged most
Aire ServHVAC
-0.41 pts
Mr. RooterPlumbing & Drain Services
-0.40 pts
ZOOM DRAINPlumbing & Drain Services
-0.40 pts
Mister Sparky ElectricElectrical Services
-0.34 pts
Pillar To Post Home InspectorsHome Inspection
-0.29 pts
Observed model effectMixed or model dependent
Local rules and operating requirements
We separated regulations that create operating burdens from those that may create demand for qualified compliance and retrofit services.
Why concepts react differently
We modeled a measurable local rules and operating requirements impact on 3 of the 13 franchises in San Diego. Removing the entire local rules and operating requirements category changed the ranks of 2 franchises. HomeSmiles moved from #11 to #10, the largest rank change among franchises directly affected by this category.
Concepts adjusted3 of 13
Average among affected-0.59 pts
Average across all concepts-0.14 pts
Concepts changing rank2
What we observed
Statutory Minimum Wage$17.75/hour
Commercial Building Benchmarking Size Threshold50 thousand square feet
Annual Building Energy Benchmarking Filing DeadlineJune 1 annually
Concepts challenged most
Workout AnytimeFull-Service Fitness
-1.54 pts
HomeSmilesRecurring Property Maintenance
-0.13 pts
ActionCOACHBusiness Coaching
-0.10 pts
Factors without a displayed score adjustment
Local competitionNot included in the score
Driving, routing, and parkingCandidate-dependent; not included in the score
Finding and operating the right locationNot included in the score
Winning new customersNot included in the score
Referral channelsCandidate-dependent; not included in the score
Territory conditionsNot included in the score
Rank stability
Which positions depend most on individual assumptions?
Removing customer demand moved FASTSIGNS from #1 to #12.
Rankings across factor-removal testsThe leader’s margin in each testScore changes when factors are removedThe ranking with one factor removedThe local relationships behind that test
All test results
10 complete tests; 6 changed no scores; 4 active tests
Rank ranges and sensitivity labels use only distinct displayed positions; tests ending in displayed ties are reported separately. Average active-test rank excludes factor removals that changed no score and tests that ended in display ties. Factor-removal scenarios test assumptions; they are not probabilities or confidence intervals.
As a group, FASTSIGNS, PuroClean, and City Wide Facility Solutions received a larger average modeled benefit from military installation scale through customer demand than the remaining franchises.
Category comparisons
Best franchise categories we assessed in San Diego, California
Summaries require at least 2 concepts in the same category for inclusion.
Limited two-concept comparison
Limited comparison: Property Restoration franchise opportunities assessed in San Diego, California
70.84
2 Property Restoration franchises qualified for comparison, with scores ranging from 70.54 to 71.14. PuroClean ranked highest at 71.14. Customer demand added 0.99 points on average across the included franchises. Hiring and staffing conditions reduced scores across the included franchises by 0.27 points on average.
Interpret diligently: A 0.60-point spread is too small to support an unquestionable brand-level conclusion.
Concepts compared
2
Score range
70.54–71.14
Category average
70.84
PuroClean71.14
Rainbow International Restoration70.54
Limited two-concept comparison
Limited comparison: Plumbing & Drain Services franchise opportunities assessed in San Diego, California
70.16
2 Plumbing & Drain Services franchises qualified for comparison, with scores ranging from 70.03 to 70.29. ZOOM DRAIN ranked highest at 70.29. Customer demand added 0.39 points on average across the included franchises. Hiring and staffing conditions reduced scores across the included franchises by 0.40 points on average.
Interpret diligently: A 0.26-point spread is too small to support an unquestionable brand-level conclusion.
Candidate-specific considerations are required, particularly for franchises requiring a physical presence.
Conditional factors may be shown but do not affect the published score until their applicability is established.
Methodology
How the franchise scores are calculated
01
Assess city conditions
We reviewed local measures that could affect franchise operations and recorded their sources, geographic scope and evidence quality.
02
Model the operating assumptions
For San Diego city, California, 45.6% of housing is in buildings with two or more units. The multifamily housing concentration adjustment contributed +0.34 points to FASTSIGNS and +0.51 to PuroClean, a 0.17-point difference from the same local input. [3][5]
03
Apply modeled effects
Apply modeled effects at full or reduced provisional weight.
04
Highlight candidate-dependent effects
Keep candidate-specific effects outside the baseline score.
05
Test rank sensitivity
Remove one factor category at a time from every franchise and rerun scoring.
06
Generate output
Generate the data displayed on this page.
How we start out from a baseline
Every franchise starts at 70.00 points. Score differences come from modeled relationships.In San Diego, FASTSIGNS reached 71.340.Customer demand combined several local effects for a net +1.52 points. [23][6]Hiring and staffing conditions totaled -0.18 points, led by Installation, maintenance and repair mean hourly wage at -0.18 points. [8]
Scores reflect sourced local data and modeled operating assumptions. Actual impacts may vary by franchise, location, and operator.
Calculation controls
The current model caps total local movement at ±18.00 points. The score is not a percentage, probability, or estimate of investment quality.
relationship_max_effect × city_condition_strength × operating_exposure × confidence_multiplier × provenance_multiplier × geographic_applicability × profile_effect_multiplier × eligibility_multiplier, followed by channel/modifier/correlation/family/factor/total controls
Score calibration
How relationship effects become score adjustments
For FASTSIGNS, the defense-linked institutional demand example uses 3.000 x 0.550 x 0.517 x 0.978 x 0.80, approximately +0.67 points before later controls. [23]
Local condition60 ships, 250 tenant commands, 26,000 sailors, 6,000 reservists, and 30,000 civilian personnel [23]Military installation scaleStrength 0.550 / 1.000
Model calibration+3.00 pts ceilingEvidence/applicability ×0.978 · pre-cap +0.67 ptsRelationship-specific maximum
Score effect+0.67 ptsNo post-calibration control reduced this relationshipSource
Worked-example calibration inputsActual model values, not generic point bands
City-condition strength
0.550 / 1.000
Operating exposure
0.517 / 1.000
Evidence & applicability
×0.978
Relationship ceiling
3.000 pts
The model does not use one universal Minor/Moderate/Strong point table. Relationship-specific max_effect values are the actual point ceilings, so publishing generic point bands would misstate the scoring system.
How factor rows are classified
Positive local adjustmentNegative local adjustmentMeasured; no meaningful local adjustmentEffect below the publication thresholdNot applicable to this operating modelCandidate considerationsNot included in the score
Model 0.10.0 · Compiler 0.35.61-bronx-top-three-copy · Report generated October 13, 2026 (site timezone)
Model governance
How this report is calculated and corrected
Calculation controls
Model designer
Thomas Jepsen
No franchise score is manually raised or lowered after calculation.
Model history
Study updates are versioned and dated to show development and assumptions used in calculations.
Corrections policy
Corrections trigger a model rerun. Scores are updated. Some visuals may be updated less frequently.
Used for: Population change since 2020, Owner-occupied housing share, Renter-occupied housing share, Median owner-occupied home value, and Median household income
Used for: Renter-occupied housing share, Detached single-family housing share, Housing in buildings with two or more units, Median year built, and Worked-from-home share
Used for: Food preparation and serving mean hourly wage, Mean hourly wage for building and grounds occupations, Office and administrative support mean hourly wage, Construction and extraction mean hourly wage, and Installation, maintenance and repair mean hourly wage
Publisher
U.S. Bureau of Labor Statistics
Published
July 9, 2026
Data period
May 2025
Scope
San Diego-Chula Vista-Carlsbad MSA (San Diego County)
Used for: Drive-through restaurants are conditional in designated base zones, Drive-through minimum queue spaces, and Drive-through additional pre-order queue length
Used for: Elevation Certificate required for new or substantially improved insurable structures in SFHAs and Nonresidential floodproofing alternative requires certification
Publisher
City of San Diego Stormwater Department
Data period
Current as accessed 2026-08-27
Scope
Special Flood Hazard Areas in the City of San Diego
Disclaimer and broker disclosure: This analysis is informational and does not constitute financial, legal, accounting, or investment advice. Market-alignment scores do not predict financial performance or business success. Offers are made only through the delivery of a Franchise Disclosure Document. We may receive referral fees from participating franchisors; compensation is not an input to the scoring model.