Local operating-model alignment analysis

Best Franchise Opportunities in San Diego, California, According to Our Study

Compare 13 franchise concepts in San Diego and see how Naval Base San Diego β€” 60 ships, 250 tenant commands, 26,000 sailors, 6,000 reservists, and 30,000...

What β€œbest” means in this rankingBest means the franchise opportunities scoring highest in our San Diego study. The study does not estimate earning potential or determine which franchise is right for you. It does not estimate earnings or determine which franchise is best for a particular candidate.
Analysis by Thomas Jepsen, MSc Model: 0.10.0

Summary

FASTSIGNS ranks first among the franchise opportunities assessed for San Diego, California, 0.20 points ahead of PuroClean

We compared 13 franchise concepts against San Diego's modeled operating realities. Naval Base San Diego reports 60 ships, 250 tenant commands, 26,000 sailors, 6,000 reservists, and 30,000 civilian personnel. This created one of the strongest positive local signals for concepts whose operating models are sensitive to defense-linked institutional demand. [23] Owner-occupied housing share created one of the more important local constraints for concepts whose operating models are sensitive to the city's lower owner-occupancy rate. [1] [2]
FASTSIGNS scored 71.34. FASTSIGNS, PuroClean, and City Wide Facility Solutions received the highest scores of 71.34, 71.14, and 70.85 among the 13 franchise opportunities assessed under San Diego, California operating conditions. Naval Base San Diego reports 60 ships, 250 tenant commands, 26,000 sailors, 6,000 reservists, and 30,000 civilian personnel. This was the largest positive effect for FASTSIGNS and added 0.67 points through defense-linked institutional demand. [23] Across the San Diego-Chula Vista-Carlsbad MSA, the mean wage for installation, maintenance and repair occupations was $33.23/hour in May 2025. This was the largest negative effect for FASTSIGNS and lowered its score by 0.18 points through higher local labor costs. [8] Between the two, the strongest modeled relationship favoring FASTSIGNS over PuroClean came from housing units permitted. It contributed +0.43 points to FASTSIGNS' score. It had no score effect on PuroClean. A larger countervailing relationship favored PuroClean: median owner-occupied home value, with 0.00 points for FASTSIGNS versus +0.46 points for PuroClean (a 0.46-point difference). Their final ordering incorporates all modeled effects. [6] [1] [2]

Evidence assessed
  • Local reality: Naval Base San Diego reports 60 ships, 250 tenant commands, 26,000 sailors, 6,000 reservists, and 30,000 civilian personnel. [23]
  • Impact on our study: In the model, FASTSIGNS benefits from institutional demand tied to a defense-heavy local economy. The operating assumption used here is: Targets institutions or large commercial accounts.
  • Modeled consequence: The model assigned +0.67 points through defense-linked institutional demand.

What this means: this is a modeled study of documented local conditions against franchise-specific operating assumptions. It is not an investment recommendation.

Best franchise opportunities assessed

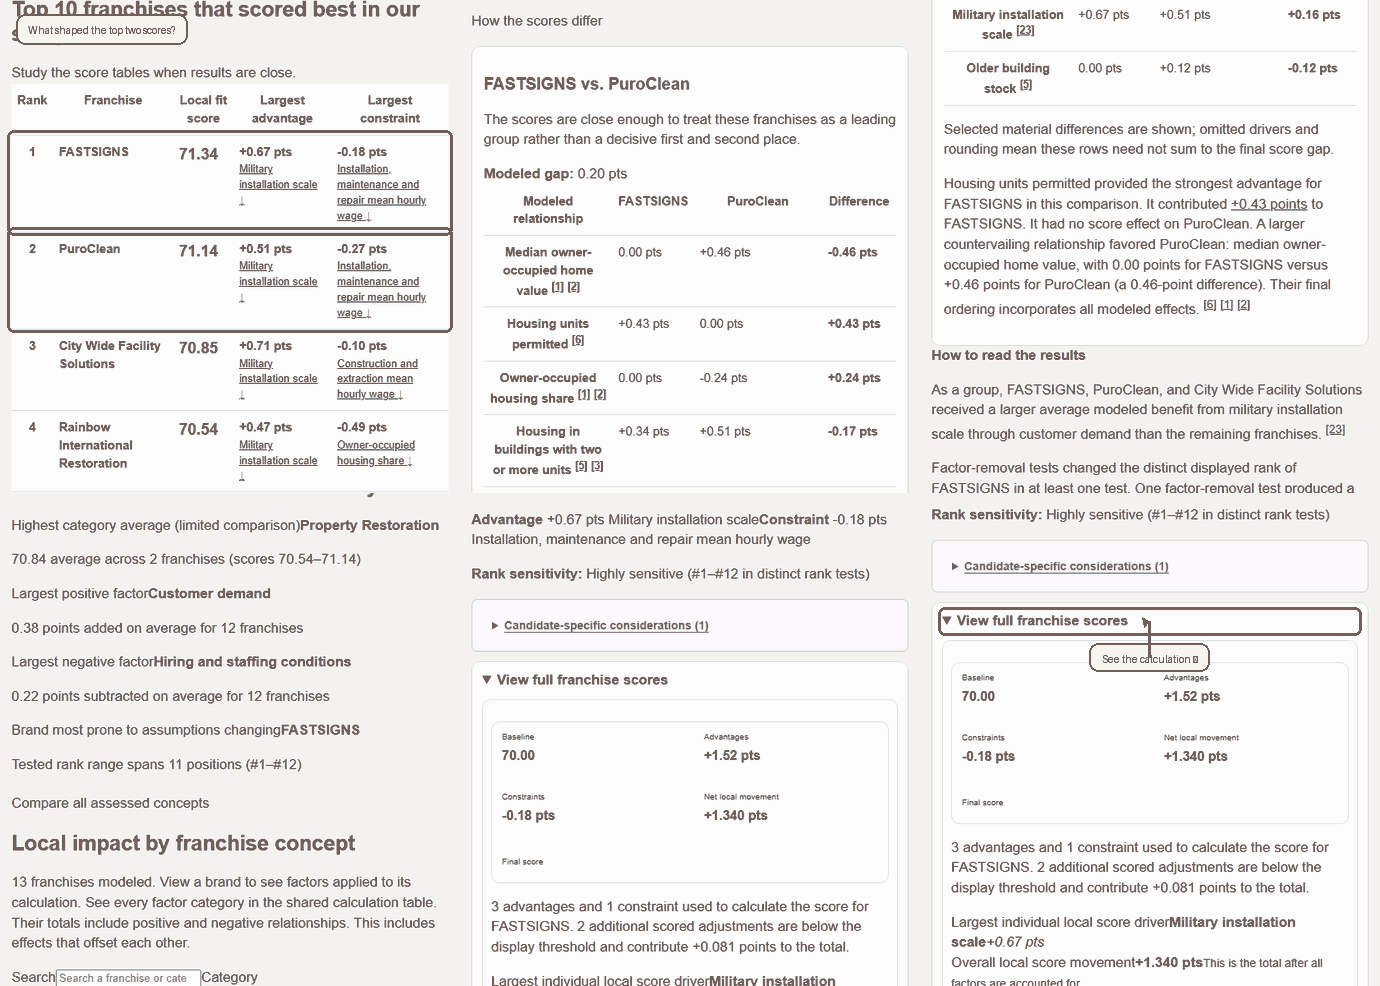
Top 10 franchises that scored best in our study

Study the score tables when results are close.
RankFranchiseLocal fit scoreLargest advantageLargest constraintEvidence confidence
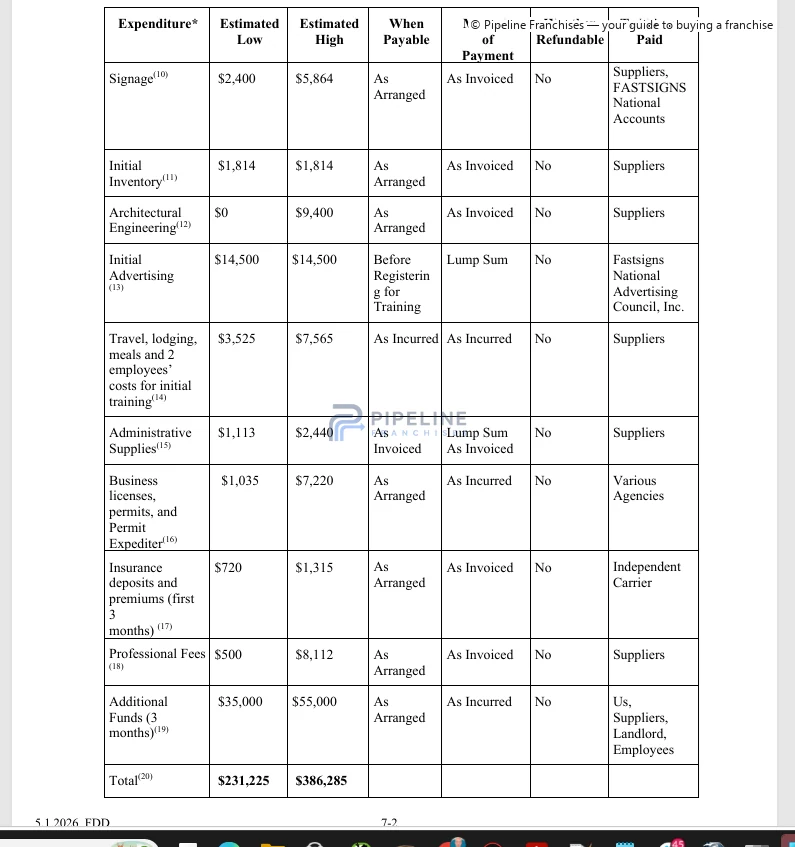
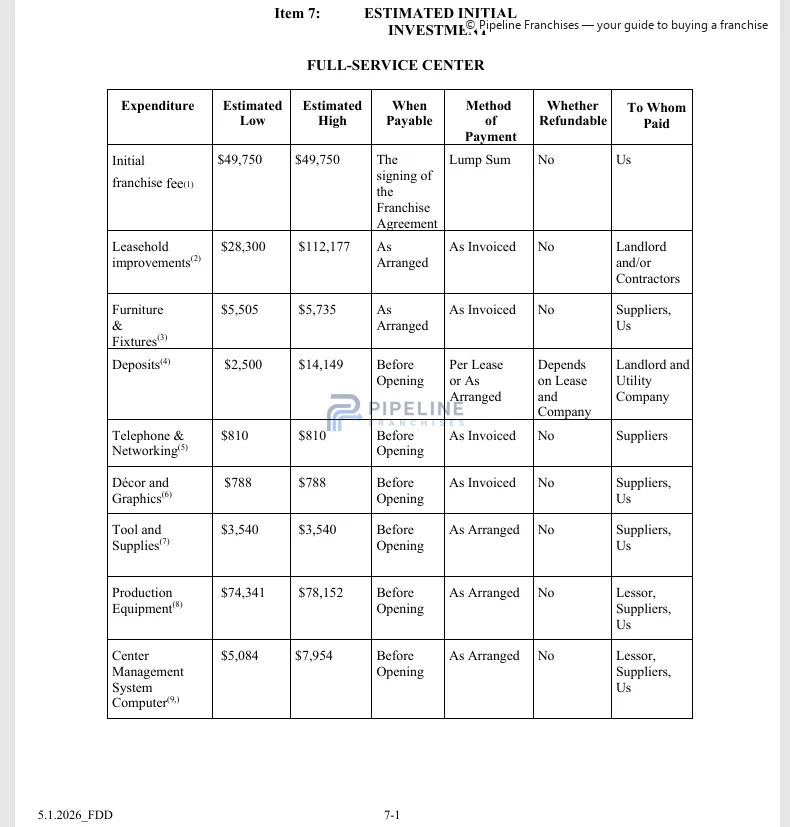
1FASTSIGNSSigns & GraphicsInvestment: $231,226–$386,285 Item 7 source
71.34
+0.67 ptsMilitary installation scale -0.18 ptsInstallation, maintenance and repair mean hourly wage Moderate evidence confidence
2PuroCleanProperty RestorationInvestment: $54,575–$262,145 Item 7 source
71.14
+0.51 ptsMilitary installation scale -0.27 ptsInstallation, maintenance and repair mean hourly wage High evidence confidence
3City Wide Facility SolutionsIntegrated Facility ManagementInvestment: $229,729–$410,730 Item 7 source
70.85
+0.71 ptsMilitary installation scale -0.10 ptsConstruction and extraction mean hourly wage Moderate evidence confidence
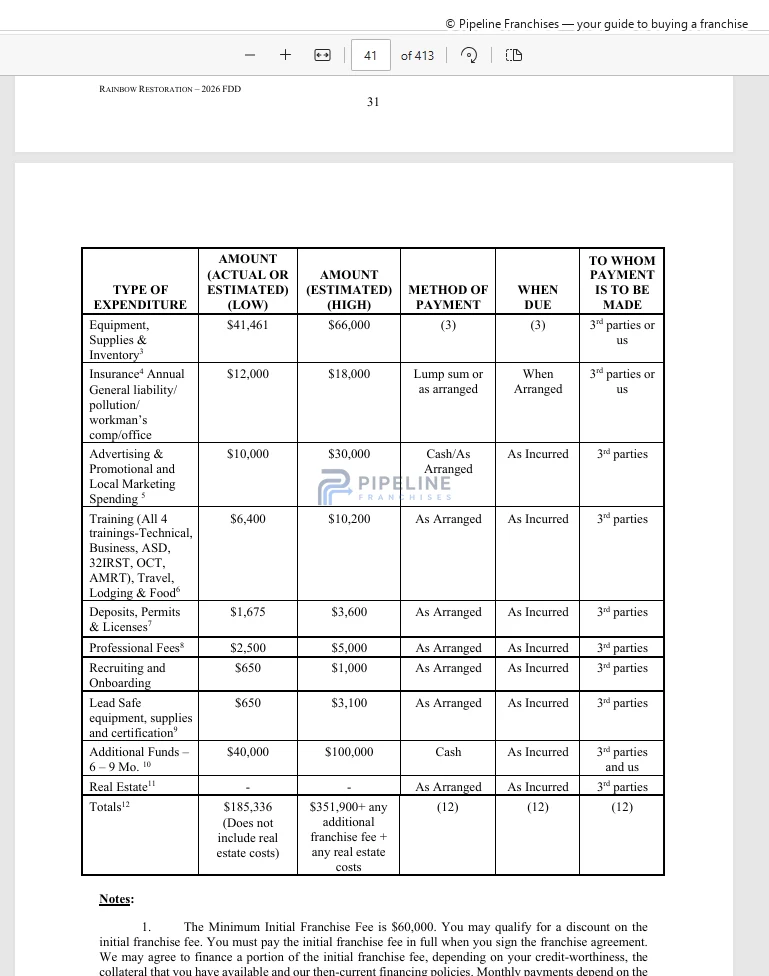
4Rainbow International RestorationProperty RestorationInvestment: $185,336–$351,900 Item 7 source
70.54
+0.47 ptsMilitary installation scale -0.49 ptsOwner-occupied housing share High evidence confidence
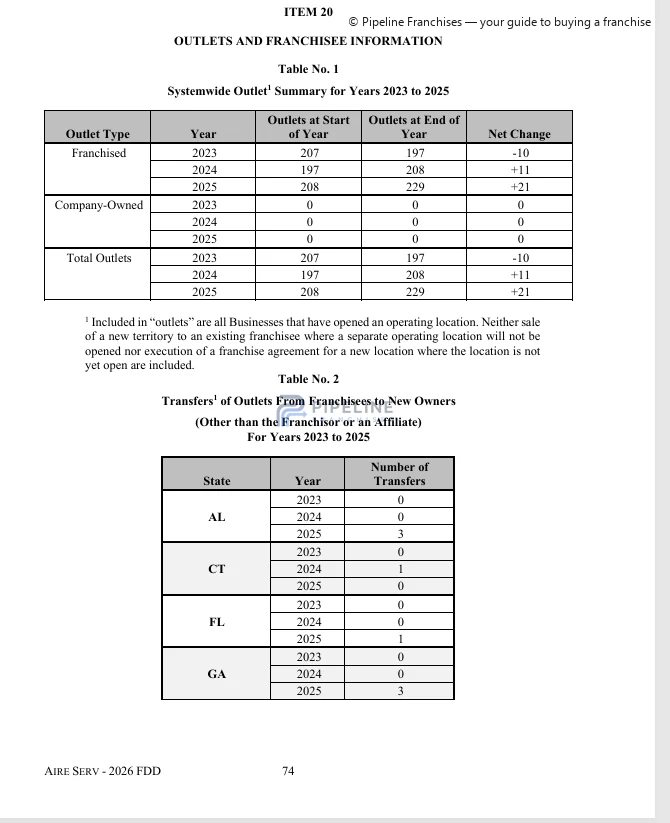
5Aire ServHVACInvestment: $113,308–$271,708 Item 7 source
70.30
+0.43 ptsMedian owner-occupied home value -0.73 ptsOwner-occupied housing share Moderate evidence confidence
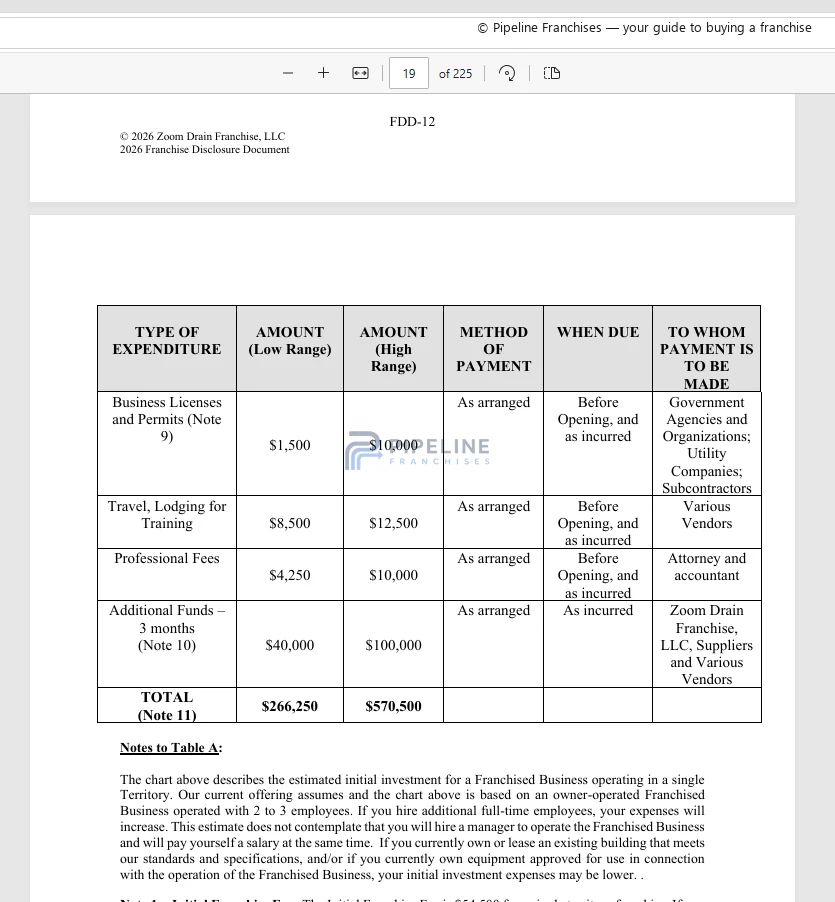
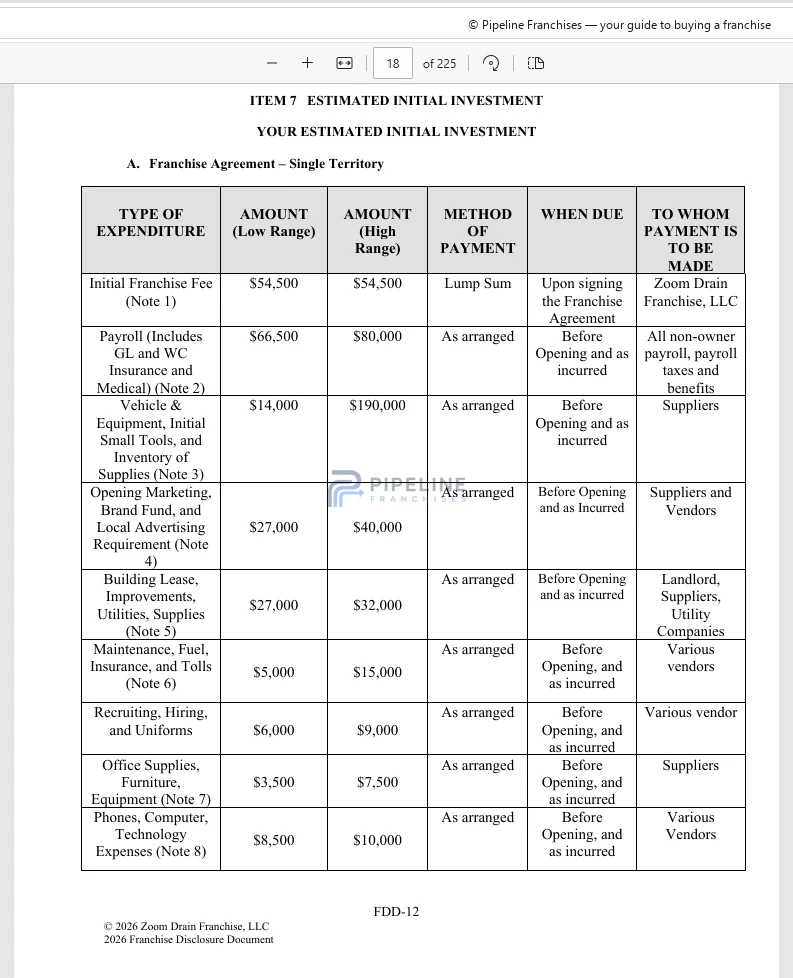
6ZOOM DRAINPlumbing & Drain ServicesInvestment: $266,250–$570,500 Item 7 source
70.29
+0.37 ptsMedian owner-occupied home value -0.72 ptsOwner-occupied housing share Moderate evidence confidence
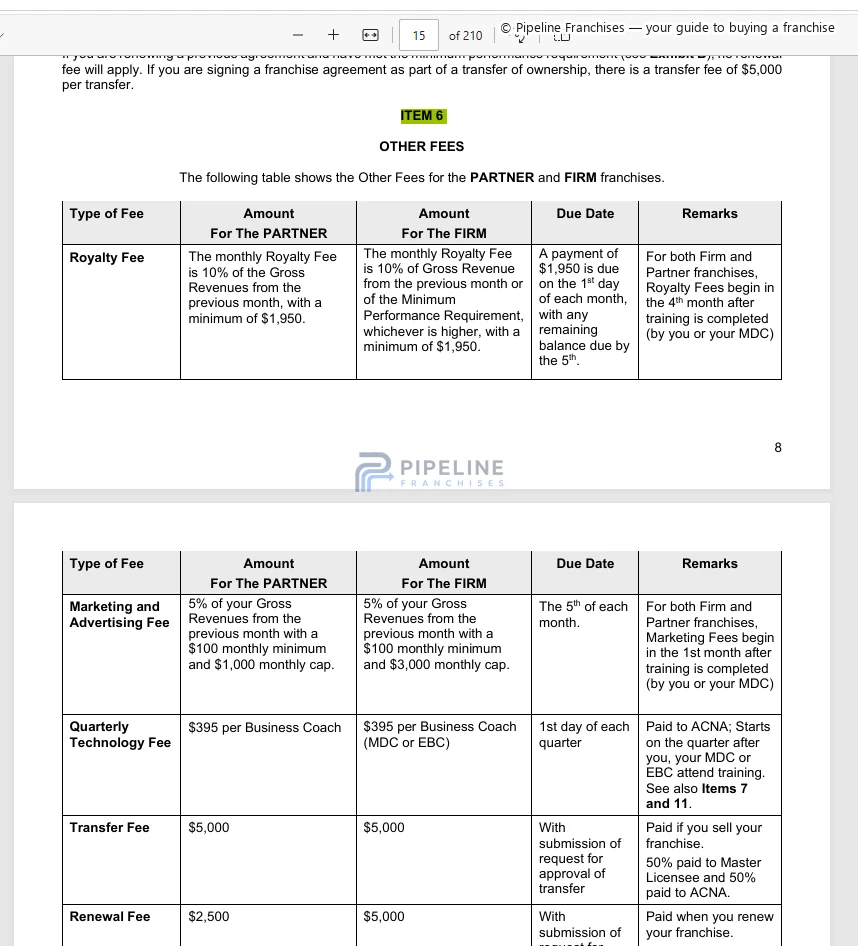
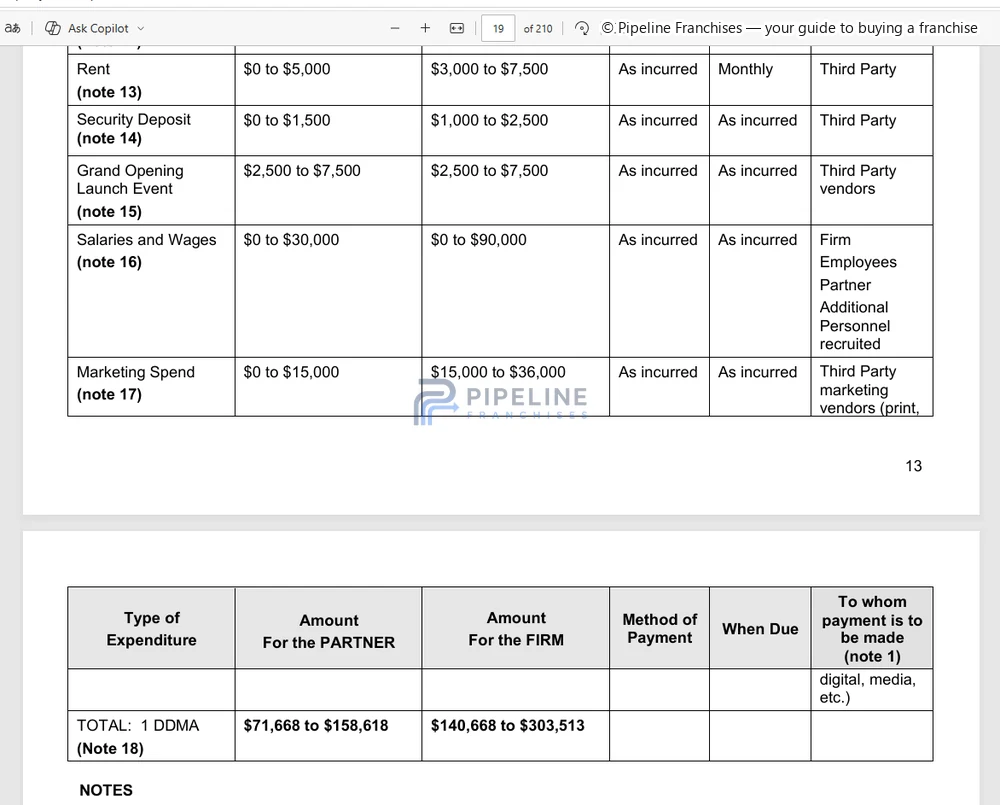
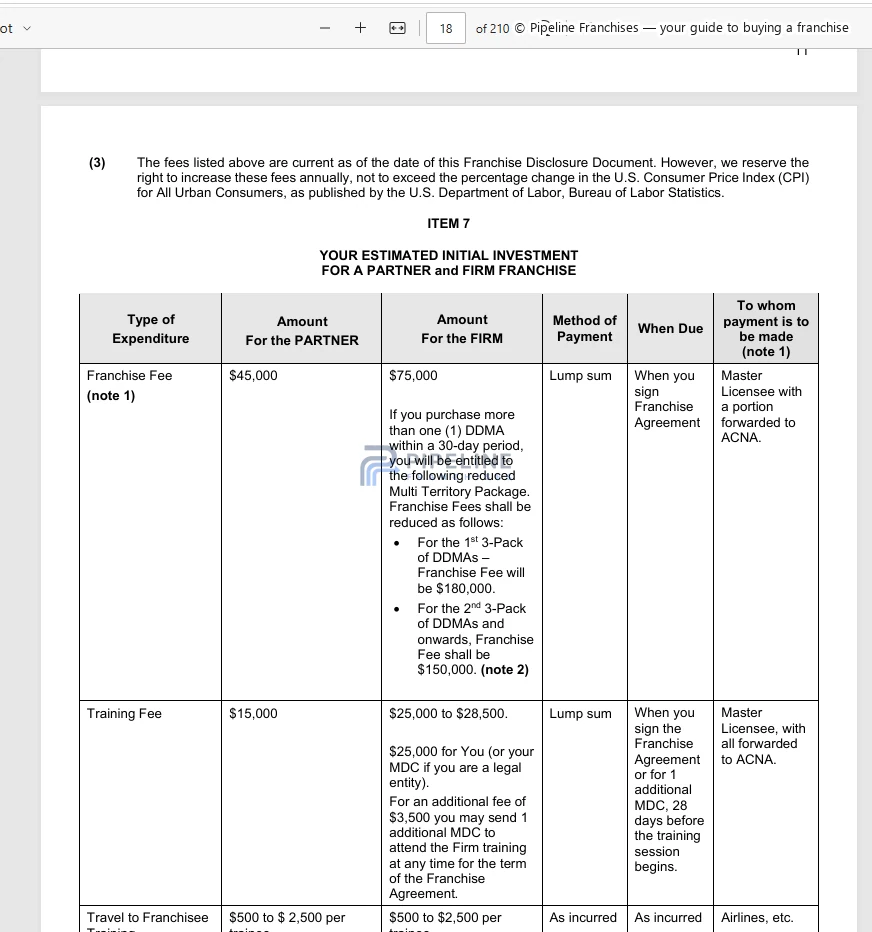
7ActionCOACHBusiness CoachingInvestment: $71,668–$303,513 Item 7 source
70.10
+0.20 ptsMilitary installation scale No material negative scored relationshipModerate evidence confidence
8Pillar To Post Home InspectorsHome InspectionInvestment: $102,690–$134,290 Item 7 source
70.09
+0.70 ptsHousing units permitted -0.73 ptsOwner-occupied housing share Moderate evidence confidence
9Mr. RooterPlumbing & Drain ServicesInvestment: $152,900–$298,675 Item 7 source
70.03
+0.37 ptsMedian owner-occupied home value -0.72 ptsOwner-occupied housing share Moderate evidence confidence
10Tiger AdjustersPublic Adjusting & Claims AdvocacyInvestment: $43,050–$159,500 Item 7 source
69.86
+0.40 ptsMedian owner-occupied home value -0.65 ptsOwner-occupied housing share Moderate evidence confidence

View all 13 score calculations

How the ranking works

Scoring walkthrough for San Diego, California

Follow the scoring workflow, then review the current results on this page.

SCORING OVERVIEW

This animation illustrates the scoring workflow. Use the current rankings and calculations on this page as the authoritative results.

Animated overview of the scoring workflow in San Diego, California.
See the current comparison and calculation

Video walkthrough: San Diego, California

Cross-concept impact analysis

The local conditions that moved scores most

A city condition changes a franchise score only when it intersects with a relevant operating-model exposure. The center shows average effect when applied; the surrounding ring shows how broadly that relationship reached across the concepts assessed.

Most impactful relationship #2
Local condition$36.54/hourConstruction and extraction mean hourly wage
Operating exposurehigher local labor costs
10 of 13 concepts affected77% of concepts assessed
Aire ServMr. RooterZOOM DRAINMister Sparky Electric+6
Most impactful relationship #3
Local condition$906,700Median owner-occupied home value
Operating exposureHigh homeowner property-value and equity…
7 of 13 concepts affected54% of concepts assessed
PuroCleanRainbow International RestorationAire ServTiger Adjusters+3
Most impactful relationship #4
Local condition45.6%Housing in buildings with two or more units
Operating exposuremultifamily housing concentration
7 of 13 concepts affected54% of concepts assessed
PuroCleanFASTSIGNSZOOM DRAINRainbow International Restoration+3
Most impactful relationship #5
Local condition1.6%Population change since 2020
Operating exposurepopulation and household growth
8 of 13 concepts affected62% of concepts assessed
HomeSmilesMister Sparky ElectricAire ServMr. Rooter+4
Details for Owner-occupied housing share Γ— the city's lower owner-occupancy rate
Relationship #1Owner-occupied housing share the city's lower owner-occupancy rate
San Diego city, California evidence47.3% [1] [2]Owner-occupied housing: 47.3%

Owner-occupied units made up 47.3% of occupied housing in San Diego city, California in the 2020–2024 estimates.

United States
65.2%
Difference
-17.9 percentage points
Model exposurethe city's lower owner-occupancy rate

Most relevant modeled attributes: homeownership dependency.

Average effect-0.66 ptsTotal absolute modeled influence5.967 ptsLargest single effect-0.89 ptsEvidence confidenceHigh
Effect across concepts
Mister Sparky ElectricElectrical Services-0.89 pts
HomeSmilesRecurring Property Maintenance-0.80 pts
Aire ServHVAC-0.73 pts
Pillar To Post Home InspectorsHome Inspection-0.73 pts
ZOOM DRAINPlumbing & Drain Services-0.72 pts
Mr. RooterPlumbing & Drain Services-0.72 pts
Tiger AdjustersPublic Adjusting & Claims Advocacy-0.65 pts
Rainbow International RestorationProperty Restoration-0.49 pts
PuroCleanProperty Restoration-0.24 pts
Selected by total absolute modeled influence across affected concepts.Source
Details for Construction and extraction mean hourly wage Γ— higher local labor costs
Relationship #2Construction and extraction mean hourly wage higher local labor costs
San Diego-Chula Vista-Carlsbad MSA evidence$36.54/hour [8]$36.54/hour mean wage for construction and extraction occupations

Across the San Diego-Chula Vista-Carlsbad MSA, the mean wage for construction and extraction occupations was $36.54/hour in May 2025.

United States
$31.42/hour
Difference
+$5.12/hour
Model exposurehigher local labor costs

Most relevant modeled attributes: skilled trade labor, technical labor, and administrative labor.

Average effect-0.28 ptsTotal absolute modeled influence2.824 ptsLargest single effect-0.41 ptsEvidence confidenceHigh
Effect across concepts
Aire ServHVAC-0.41 pts
Mr. RooterPlumbing & Drain Services-0.40 pts
ZOOM DRAINPlumbing & Drain Services-0.40 pts
Mister Sparky ElectricElectrical Services-0.34 pts
Pillar To Post Home InspectorsHome Inspection-0.29 pts
PuroCleanProperty Restoration-0.27 pts
Rainbow International RestorationProperty Restoration-0.27 pts
FASTSIGNSSigns & Graphics-0.18 pts
Tiger AdjustersPublic Adjusting & Claims Advocacy-0.15 pts
City Wide Facility SolutionsIntegrated Facility Management-0.10 pts
Selected by total absolute modeled influence across affected concepts.Source
Details for Median owner-occupied home value Γ— High homeowner property-value and equity capacity
Relationship #3Median owner-occupied home value High homeowner property-value and equity capacity
San Diego city, California evidence$906,700 [1] [2]$906,700 median owner-occupied home value

Median owner-occupied home value: $906,700 in San Diego city, California.

United States
$332,700
Difference
+$574,000
Model exposureHigh homeowner property-value and equity capacity

Most relevant modeled attributes: high average ticket.

Average effect+0.40 ptsTotal absolute modeled influence2.794 ptsLargest single effect+0.46 ptsEvidence confidenceHigh
Effect across concepts
PuroCleanProperty Restoration+0.46 pts
Rainbow International RestorationProperty Restoration+0.46 pts
Aire ServHVAC+0.43 pts
Tiger AdjustersPublic Adjusting & Claims Advocacy+0.40 pts
ZOOM DRAINPlumbing & Drain Services+0.37 pts
Mr. RooterPlumbing & Drain Services+0.37 pts
Mister Sparky ElectricElectrical Services+0.31 pts
Selected by total absolute modeled influence across affected concepts.Source
Details for Housing in buildings with two or more units Γ— multifamily housing concentration
Relationship #4Housing in buildings with two or more units multifamily housing concentration
San Diego city, California evidence45.6% [5] [3]45.6% of housing in buildings with two or more units

For San Diego city, California, 45.6% of housing is in buildings with two or more units.

United States 2+ unit share derived from ACS DP04 structure categories (2024)
27%
Difference
+18.6 percentage points
Cross-period benchmark: local 2019-2023; benchmark 2024.
Model exposuremultifamily housing concentration

Most relevant modeled attributes: property manager sales, multi family housing dependency, and recurring commercial demand.

Average effect+0.26 ptsTotal absolute modeled influence1.789 ptsLargest single effect+0.51 ptsEvidence confidenceModerate
Effect across concepts
PuroCleanProperty Restoration+0.51 pts
FASTSIGNSSigns & Graphics+0.34 pts
ZOOM DRAINPlumbing & Drain Services+0.25 pts
Rainbow International RestorationProperty Restoration+0.20 pts
Aire ServHVAC+0.19 pts
Tiger AdjustersPublic Adjusting & Claims Advocacy+0.17 pts
HomeSmilesRecurring Property Maintenance+0.13 pts
Selected by total absolute modeled influence across affected concepts.Source
Details for Population change since 2020 Γ— population and household growth
Relationship #5Population change since 2020 population and household growth
San Diego city, California evidence1.6% [1] [2]population change since 2020: 1.6%

The population estimate for San Diego city, California is 1.6% above its 2020 baseline.

United States
3.1%
Difference
-1.5 percentage points
Model exposurepopulation and household growth

Most relevant modeled attributes: scheduled residential service, recurring residential demand, and resident population density dependency.

Average effect+0.21 ptsTotal absolute modeled influence1.657 ptsLargest single effect+0.33 ptsEvidence confidenceHigh
Effect across concepts
HomeSmilesRecurring Property Maintenance+0.33 pts
Mister Sparky ElectricElectrical Services+0.28 pts
Aire ServHVAC+0.26 pts
Mr. RooterPlumbing & Drain Services+0.26 pts
ZOOM DRAINPlumbing & Drain Services+0.22 pts
Pillar To Post Home InspectorsHome Inspection+0.19 pts
Tiger AdjustersPublic Adjusting & Claims Advocacy+0.06 pts
Workout AnytimeFull-Service Fitness+0.06 pts
Selected by total absolute modeled influence across affected concepts.Source

Conditions visualized

Some San Diego conditions affect franchise models differently

See how local conditions affect modeled operating exposure, exact score contributions and the resulting differences. Click to open the images.

Why the ranking came out this way

#1 vs. #2

How the scores differ

FASTSIGNS vs. PuroClean

The scores are close enough to treat these franchises as a leading group rather than a decisive first and second place.

Modeled gap: 0.20 pts
Modeled relationshipFASTSIGNSPuroCleanDifference
Median owner-occupied home value [1] [2]0.00 pts+0.46 pts-0.46 pts
Housing units permitted [6]+0.43 pts0.00 pts+0.43 pts
Owner-occupied housing share [1] [2]0.00 pts-0.24 pts+0.24 pts
Housing in buildings with two or more units [5] [3]+0.34 pts+0.51 pts-0.17 pts
Military installation scale [23]+0.67 pts+0.51 pts+0.16 pts
Older building stock [5]0.00 pts+0.12 pts-0.12 pts

Selected material differences are shown; omitted drivers and rounding mean these rows need not sum to the final score gap.

Housing units permitted provided the strongest advantage for FASTSIGNS in this comparison. It contributed +0.43 points to FASTSIGNS. It had no score effect on PuroClean. A larger countervailing relationship favored PuroClean: median owner-occupied home value, with 0.00 points for FASTSIGNS versus +0.46 points for PuroClean (a 0.46-point difference). Their final ordering incorporates all modeled effects. [6] [1] [2]

How to read the results

As a group, FASTSIGNS, PuroClean, and City Wide Facility Solutions received a larger average modeled benefit from military installation scale through customer demand than the remaining franchises. [23]

Factor-removal tests changed the distinct displayed rank of FASTSIGNS in at least one test. One factor-removal test produced a displayed-score tie, which does not establish a unique rank within that tied group.

Contribution path

Contribution path for FASTSIGNS

Baseline70.00Final71.34Net change+1.34 pts
Scored local driverRelationship effectScore after driver
Military installation scale [23]Defense/aerospace economic concentration
+0.67 pts
70.67
Housing units permitted [6]Construction and renovation activity
+0.43 pts
71.09
Housing in buildings with two or more units [5] [3]Multifamily housing concentration
+0.34 pts
71.44
Installation, maintenance and repair mean hourly wage [8]High local occupational wage cost environment
-0.18 pts
71.26
Other modeled adjustments below the display threshold
+0.08 pts
71.34
13Franchises evaluated
52Local sources used
44Primary local sources
77Local metrics

Evaluation set

Why these franchises?

This is not an exhaustive list of available franchises.

13Brands evaluated

We included brands with enough operating or public information to build scoring models, using materials from various sources.

Unresolved inputs may reduce confidence or remain conditional until their applicability is established.

Pipeline Franchises working with a brand does not add points in the analysis.

Study conclusions

Notable observations from our study

Highest category average (limited comparison)Property Restoration

70.84 average across 2 franchises (scores 70.54–71.14)

Largest positive factorCustomer demand

0.38 points added on average for 12 franchises

Largest negative factorHiring and staffing conditions

0.22 points subtracted on average for 12 franchises

Brand most prone to assumptions changingFASTSIGNS

Tested rank range spans 11 positions (#1–#12)

Compare all assessed concepts

Local impact by franchise concept

13 franchises modeled. View a brand to see factors applied to its calculation. See every factor category in the shared calculation table. Their totals include positive and negative relationships. This includes effects that offset each other.

Full score ledger

Scroll across to compare franchises. Select a score contribution to inspect its calculation and evidence.

Positive scored effectNegative scored effectMeasured; no meaningful local adjustmentNot included in the scoreContext only; not included in the scoreCandidate-dependent; not included in the scoreNot applicable to this operating modelNot availableNo material operating exposure resolvedNo material score adjustment
Full score ledger
Score component#1FASTSIGNS71.34#2PuroClean71.14#3City Wide Facility Solutions70.85#4Rainbow International Restoration70.54#5Aire Serv70.30#6ZOOM DRAIN70.29#7ActionCOACH70.10#8Pillar To Post Home Inspectors70.09#9Mr. Rooter70.03#10Tiger Adjusters69.86#11HomeSmiles69.76#12Mister Sparky Electric69.69#13Workout Anytime67.73
Neutral model baseline70.0070.0070.0070.0070.0070.0070.0070.0070.0070.0070.0070.0070.00
Median gross rentHousing costs squeezing gym-membership spendingSan Diego city, California
-0.89
Evidence confidence: HighSource [1] [2]
Local observationMedian gross rent$2,313 per monthSan Diego city, California2020–2024
Operating relationshiphousing costs squeezing gym-membership spending
Calculation controls
Relationship maximum
2.5
City-condition strength
0.7
Operating exposure
0.6512
Evidence confidence
1
Provenance multiplier
1
Geographic applicability
1
Profile effect multiplier
0.9775
Eligibility weight
0.8
Effect before model controls
-0.891116
Final effect
-0.891116
Single-relationship cap
1
Modifier cap
1
Correlation control
1
Effect-family cap
1
Factor cap
1
Total local-movement cap
1
Owner-occupied housing shareLow homeownership concentrationSan Diego city, California
-0.24
Evidence confidence: HighSource [1] [2]
Local observationOwner-occupied housing share47.3%San Diego city, California2020–2024
Operating relationshipthe city's lower owner-occupancy rate
Calculation controls
Relationship maximum
3
City-condition strength
0.55
Operating exposure
0.3
Evidence confidence
1
Provenance multiplier
1
Geographic applicability
1
Profile effect multiplier
0.9825
Eligibility weight
1
Effect before model controls
-0.486338
Final effect
-0.243169
Single-relationship cap
1
Modifier cap
1
Correlation control
0.5
Effect-family cap
1
Factor cap
1
Total local-movement cap
1
-0.49
Largest driverRelationship test: Rank #4 to #3 without this driver.Evidence confidence: HighSource [1] [2]
Local observationOwner-occupied housing share47.3%San Diego city, California2020–2024
Operating relationshipthe city's lower owner-occupancy rate
Calculation controls
Relationship maximum
3
City-condition strength
0.55
Operating exposure
0.3
Evidence confidence
1
Provenance multiplier
1
Geographic applicability
1
Profile effect multiplier
0.98
Eligibility weight
1
Effect before model controls
-0.4851
Final effect
-0.4851
Single-relationship cap
1
Modifier cap
1
Correlation control
1
Effect-family cap
1
Factor cap
1
Total local-movement cap
1
-0.73
Largest driverRelationship test: Rank stays #5 without this driver.Evidence confidence: HighSource [1] [2]
Local observationOwner-occupied housing share47.3%San Diego city, California2020–2024
Operating relationshipthe city's lower owner-occupancy rate
Calculation controls
Relationship maximum
3
City-condition strength
0.55
Operating exposure
0.45
Evidence confidence
1
Provenance multiplier
1
Geographic applicability
1
Profile effect multiplier
0.9775
Eligibility weight
1
Effect before model controls
-0.725794
Final effect
-0.725794
Single-relationship cap
1
Modifier cap
1
Correlation control
1
Effect-family cap
1
Factor cap
1
Total local-movement cap
1
-0.72
Largest driverRelationship test: Rank #6 to #4 without this driver.Evidence confidence: HighSource [1] [2]
Local observationOwner-occupied housing share47.3%San Diego city, California2020–2024
Operating relationshipthe city's lower owner-occupancy rate
Calculation controls
Relationship maximum
3
City-condition strength
0.55
Operating exposure
0.45
Evidence confidence
1
Provenance multiplier
1
Geographic applicability
1
Profile effect multiplier
0.975
Eligibility weight
1
Effect before model controls
-0.723938
Final effect
-0.723938
Single-relationship cap
1
Modifier cap
1
Correlation control
1
Effect-family cap
1
Factor cap
1
Total local-movement cap
1
-0.73
Largest driverRelationship test: Rank #8 to #7 without this driver.Evidence confidence: HighSource [1] [2]
Local observationOwner-occupied housing share47.3%San Diego city, California2020–2024
Operating relationshipthe city's lower owner-occupancy rate
Calculation controls
Relationship maximum
3
City-condition strength
0.55
Operating exposure
0.45
Evidence confidence
1
Provenance multiplier
1
Geographic applicability
1
Profile effect multiplier
0.9775
Eligibility weight
1
Effect before model controls
-0.725794
Final effect
-0.725794
Single-relationship cap
1
Modifier cap
1
Correlation control
1
Effect-family cap
1
Factor cap
1
Total local-movement cap
1
-0.72
Largest driverRelationship test: Rank stays #9 without this driver.Evidence confidence: HighSource [1] [2]
Local observationOwner-occupied housing share47.3%San Diego city, California2020–2024
Operating relationshipthe city's lower owner-occupancy rate
Calculation controls
Relationship maximum
3
City-condition strength
0.55
Operating exposure
0.45
Evidence confidence
1
Provenance multiplier
1
Geographic applicability
1
Profile effect multiplier
0.975
Eligibility weight
1
Effect before model controls
-0.723938
Final effect
-0.723938
Single-relationship cap
1
Modifier cap
1
Correlation control
1
Effect-family cap
1
Factor cap
1
Total local-movement cap
1
-0.65
Largest driverRelationship test: Rank #10 to #8 without this driver.Evidence confidence: HighSource [1] [2]
Local observationOwner-occupied housing share47.3%San Diego city, California2020–2024
Operating relationshipthe city's lower owner-occupancy rate
Calculation controls
Relationship maximum
3
City-condition strength
0.55
Operating exposure
0.4
Evidence confidence
1
Provenance multiplier
1
Geographic applicability
1
Profile effect multiplier
0.9775
Eligibility weight
1
Effect before model controls
-0.64515
Final effect
-0.64515
Single-relationship cap
1
Modifier cap
1
Correlation control
1
Effect-family cap
1
Factor cap
1
Total local-movement cap
1
-0.80
Largest driverRelationship test: Rank stays #11 without this driver.Evidence confidence: HighSource [1] [2]
Local observationOwner-occupied housing share47.3%San Diego city, California2020–2024
Operating relationshipthe city's lower owner-occupancy rate
Calculation controls
Relationship maximum
3
City-condition strength
0.55
Operating exposure
0.5
Evidence confidence
1
Provenance multiplier
1
Geographic applicability
1
Profile effect multiplier
0.975
Eligibility weight
1
Effect before model controls
-0.804375
Final effect
-0.804375
Single-relationship cap
1
Modifier cap
1
Correlation control
1
Effect-family cap
1
Factor cap
1
Total local-movement cap
1
-0.89
Largest driverRelationship test: Rank #12 to #10 without this driver.Evidence confidence: HighSource [1] [2]
Local observationOwner-occupied housing share47.3%San Diego city, California2020–2024
Operating relationshipthe city's lower owner-occupancy rate
Calculation controls
Relationship maximum
3
City-condition strength
0.55
Operating exposure
0.55
Evidence confidence
1
Provenance multiplier
1
Geographic applicability
1
Profile effect multiplier
0.98
Eligibility weight
1
Effect before model controls
-0.88935
Final effect
-0.88935
Single-relationship cap
1
Modifier cap
1
Correlation control
1
Effect-family cap
1
Factor cap
1
Total local-movement cap
1
Military installation scaleDefense/aerospace economic concentrationNaval Base San Diego
+0.67
Largest driverRelationship test: Rank stays #1 without this driver.Evidence confidence: HighSource [23]
Local observationMilitary installation scale60 ships, 250 tenant commands, 26,000 sailors, 6,000 reservists, and 30,000 civilian personnelNaval Base San DiegoCurrent 2026
Operating relationshipdefense-linked institutional demand
Calculation controls
Relationship maximum
3
City-condition strength
0.55
Operating exposure
0.5174
Evidence confidence
1
Provenance multiplier
1
Geographic applicability
1
Profile effect multiplier
0.9775
Eligibility weight
0.8
Effect before model controls
0.66759
Final effect
0.66759
Single-relationship cap
1
Modifier cap
1
Correlation control
1
Effect-family cap
1
Factor cap
1
Total local-movement cap
1
+0.51
Largest driverRelationship test: Rank stays #2 without this driver.Evidence confidence: HighSource [23]
Local observationMilitary installation scale60 ships, 250 tenant commands, 26,000 sailors, 6,000 reservists, and 30,000 civilian personnelNaval Base San DiegoCurrent 2026
Operating relationshipdefense-linked institutional demand
Calculation controls
Relationship maximum
3
City-condition strength
0.55
Operating exposure
0.3957
Evidence confidence
1
Provenance multiplier
1
Geographic applicability
1
Profile effect multiplier
0.9825
Eligibility weight
0.8
Effect before model controls
0.513121
Final effect
0.513121
Single-relationship cap
1
Modifier cap
1
Correlation control
1
Effect-family cap
1
Factor cap
1
Total local-movement cap
1
+0.71
Largest driverRelationship test: Rank stays #3 without this driver.Evidence confidence: HighSource [23]
Local observationMilitary installation scale60 ships, 250 tenant commands, 26,000 sailors, 6,000 reservists, and 30,000 civilian personnelNaval Base San DiegoCurrent 2026
Operating relationshipdefense-linked institutional demand
Calculation controls
Relationship maximum
3
City-condition strength
0.55
Operating exposure
0.5478
Evidence confidence
1
Provenance multiplier
1
Geographic applicability
1
Profile effect multiplier
0.9775
Eligibility weight
0.8
Effect before model controls
0.70686
Final effect
0.70686
Single-relationship cap
1
Modifier cap
1
Correlation control
1
Effect-family cap
1
Factor cap
1
Total local-movement cap
1
+0.47
Evidence confidence: HighSource [23]
Local observationMilitary installation scale60 ships, 250 tenant commands, 26,000 sailors, 6,000 reservists, and 30,000 civilian personnelNaval Base San DiegoCurrent 2026
Operating relationshipdefense-linked institutional demand
Calculation controls
Relationship maximum
3
City-condition strength
0.55
Operating exposure
0.3652
Evidence confidence
1
Provenance multiplier
1
Geographic applicability
1
Profile effect multiplier
0.98
Eligibility weight
0.8
Effect before model controls
0.472445
Final effect
0.472445
Single-relationship cap
1
Modifier cap
1
Correlation control
1
Effect-family cap
1
Factor cap
1
Total local-movement cap
1
+0.20
Evidence confidence: HighSource [23]
Local observationMilitary installation scale60 ships, 250 tenant commands, 26,000 sailors, 6,000 reservists, and 30,000 civilian personnelNaval Base San DiegoCurrent 2026
Operating relationshipdefense-linked institutional demand
Calculation controls
Relationship maximum
3
City-condition strength
0.55
Operating exposure
0.1522
Evidence confidence
1
Provenance multiplier
1
Geographic applicability
1
Profile effect multiplier
0.975
Eligibility weight
0.8
Effect before model controls
0.195848
Final effect
0.195848
Single-relationship cap
1
Modifier cap
1
Correlation control
1
Effect-family cap
1
Factor cap
1
Total local-movement cap
1
+0.20
Largest driverRelationship test: Rank #7 to #8 without this driver.Evidence confidence: HighSource [23]
Local observationMilitary installation scale60 ships, 250 tenant commands, 26,000 sailors, 6,000 reservists, and 30,000 civilian personnelNaval Base San DiegoCurrent 2026
Operating relationshipdefense-linked institutional demand
Calculation controls
Relationship maximum
3
City-condition strength
0.55
Operating exposure
0.1522
Evidence confidence
1
Provenance multiplier
1
Geographic applicability
1
Profile effect multiplier
0.9775
Eligibility weight
0.8
Effect before model controls
0.19635
Final effect
0.19635
Single-relationship cap
1
Modifier cap
1
Correlation control
1
Effect-family cap
1
Factor cap
1
Total local-movement cap
1
+0.35
Evidence confidence: HighSource [23]
Local observationMilitary installation scale60 ships, 250 tenant commands, 26,000 sailors, 6,000 reservists, and 30,000 civilian personnelNaval Base San DiegoCurrent 2026
Operating relationshipdefense-linked institutional demand
Calculation controls
Relationship maximum
3
City-condition strength
0.55
Operating exposure
0.2739
Evidence confidence
1
Provenance multiplier
1
Geographic applicability
1
Profile effect multiplier
0.975
Eligibility weight
0.8
Effect before model controls
0.352526
Final effect
0.352526
Single-relationship cap
1
Modifier cap
1
Correlation control
1
Effect-family cap
1
Factor cap
1
Total local-movement cap
1
+0.35
Evidence confidence: HighSource [23]
Local observationMilitary installation scale60 ships, 250 tenant commands, 26,000 sailors, 6,000 reservists, and 30,000 civilian personnelNaval Base San DiegoCurrent 2026
Operating relationshipdefense-linked institutional demand
Calculation controls
Relationship maximum
3
City-condition strength
0.55
Operating exposure
0.2739
Evidence confidence
1
Provenance multiplier
1
Geographic applicability
1
Profile effect multiplier
0.975
Eligibility weight
0.8
Effect before model controls
0.352526
Final effect
0.352526
Single-relationship cap
1
Modifier cap
1
Correlation control
1
Effect-family cap
1
Factor cap
1
Total local-movement cap
1
Housing units permittedNew-home construction and subdivision momentumSan Diego city, California
+0.21
Evidence confidence: HighSource [6]
Local observationHousing units permitted8,782 housing unitsSan Diego city, California2024
Operating relationshipnew-home construction and subdivision growth
Calculation controls
Relationship maximum
3
City-condition strength
0.55
Operating exposure
0.1622
Evidence confidence
1
Provenance multiplier
1
Geographic applicability
1
Profile effect multiplier
0.9775
Eligibility weight
0.8
Effect before model controls
0.209238
Final effect
0.209238
Single-relationship cap
1
Modifier cap
1
Correlation control
1
Effect-family cap
1
Factor cap
1
Total local-movement cap
1
+0.17
Evidence confidence: HighSource [6]
Local observationHousing units permitted8,782 housing unitsSan Diego city, California2024
Operating relationshipnew-home construction and subdivision growth
Calculation controls
Relationship maximum
3
City-condition strength
0.55
Operating exposure
0.1351
Evidence confidence
1
Provenance multiplier
1
Geographic applicability
1
Profile effect multiplier
0.975
Eligibility weight
0.8
Effect before model controls
0.173919
Final effect
0.173919
Single-relationship cap
1
Modifier cap
1
Correlation control
1
Effect-family cap
1
Factor cap
1
Total local-movement cap
1
+0.70
Evidence confidence: HighSource [6]
Local observationHousing units permitted8,782 housing unitsSan Diego city, California2024
Operating relationshipnew-home construction and subdivision growth
Calculation controls
Relationship maximum
3
City-condition strength
0.55
Operating exposure
0.5405
Evidence confidence
1
Provenance multiplier
1
Geographic applicability
1
Profile effect multiplier
0.9775
Eligibility weight
0.8
Effect before model controls
0.697459
Final effect
0.697459
Single-relationship cap
1
Modifier cap
1
Correlation control
1
Effect-family cap
1
Factor cap
1
Total local-movement cap
1
+0.17
Evidence confidence: HighSource [6]
Local observationHousing units permitted8,782 housing unitsSan Diego city, California2024
Operating relationshipnew-home construction and subdivision growth
Calculation controls
Relationship maximum
3
City-condition strength
0.55
Operating exposure
0.1351
Evidence confidence
1
Provenance multiplier
1
Geographic applicability
1
Profile effect multiplier
0.975
Eligibility weight
0.8
Effect before model controls
0.173919
Final effect
0.173919
Single-relationship cap
1
Modifier cap
1
Correlation control
1
Effect-family cap
1
Factor cap
1
Total local-movement cap
1
+0.10
Evidence confidence: HighSource [6]
Local observationHousing units permitted8,782 housing unitsSan Diego city, California2024
Operating relationshipnew-home construction and subdivision growth
Calculation controls
Relationship maximum
3
City-condition strength
0.55
Operating exposure
0.0811
Evidence confidence
1
Provenance multiplier
1
Geographic applicability
1
Profile effect multiplier
0.98
Eligibility weight
0.8
Effect before model controls
0.104886
Final effect
0.104886
Single-relationship cap
1
Modifier cap
1
Correlation control
1
Effect-family cap
1
Factor cap
1
Total local-movement cap
1
Housing in buildings with two or more unitsMultifamily housing concentrationSan Diego city, California
+0.34
Evidence confidence: ModerateSource [5] [3]
Local observationHousing in buildings with two or more units45.6%San Diego city, California2019–2023
Operating relationshipmultifamily housing concentration
Calculation controls
Relationship maximum
3
City-condition strength
0.55
Operating exposure
0.355
Evidence confidence
0.75
Provenance multiplier
1
Geographic applicability
1
Profile effect multiplier
0.9775
Eligibility weight
0.8
Effect before model controls
0.343542
Final effect
0.343542
Single-relationship cap
1
Modifier cap
1
Correlation control
1
Effect-family cap
1
Factor cap
1
Total local-movement cap
1
+0.51
Evidence confidence: ModerateSource [5] [3]
Local observationHousing in buildings with two or more units45.6%San Diego city, California2019–2023
Operating relationshipmultifamily housing concentration
Calculation controls
Relationship maximum
3
City-condition strength
0.55
Operating exposure
0.5225
Evidence confidence
0.75
Provenance multiplier
1
Geographic applicability
1
Profile effect multiplier
0.9825
Eligibility weight
0.8
Effect before model controls
0.508223
Final effect
0.508223
Single-relationship cap
1
Modifier cap
1
Correlation control
1
Effect-family cap
1
Factor cap
1
Total local-movement cap
1
+0.20
Evidence confidence: ModerateSource [5] [3]
Local observationHousing in buildings with two or more units45.6%San Diego city, California2019–2023
Operating relationshipmultifamily housing concentration
Calculation controls
Relationship maximum
3
City-condition strength
0.55
Operating exposure
0.4025
Evidence confidence
0.75
Provenance multiplier
1
Geographic applicability
1
Profile effect multiplier
0.98
Eligibility weight
0.8
Effect before model controls
0.390506
Final effect
0.195253
Single-relationship cap
1
Modifier cap
1
Correlation control
0.5
Effect-family cap
1
Factor cap
1
Total local-movement cap
1
+0.19
Evidence confidence: ModerateSource [5] [3]
Local observationHousing in buildings with two or more units45.6%San Diego city, California2019–2023
Operating relationshipmultifamily housing concentration
Calculation controls
Relationship maximum
3
City-condition strength
0.55
Operating exposure
0.3912
Evidence confidence
0.75
Provenance multiplier
1
Geographic applicability
1
Profile effect multiplier
0.9775
Eligibility weight
0.8
Effect before model controls
0.378622
Final effect
0.189311
Single-relationship cap
1
Modifier cap
1
Correlation control
0.5
Effect-family cap
1
Factor cap
1
Total local-movement cap
1
+0.25
Evidence confidence: ModerateSource [5] [3]
Local observationHousing in buildings with two or more units45.6%San Diego city, California2019–2023
Operating relationshipmultifamily housing concentration
Calculation controls
Relationship maximum
3
City-condition strength
0.55
Operating exposure
0.5237
Evidence confidence
0.75
Provenance multiplier
1
Geographic applicability
1
Profile effect multiplier
0.975
Eligibility weight
0.8
Effect before model controls
0.50555
Final effect
0.252775
Single-relationship cap
1
Modifier cap
1
Correlation control
0.5
Effect-family cap
1
Factor cap
1
Total local-movement cap
1
+0.17
Evidence confidence: ModerateSource [5] [3]
Local observationHousing in buildings with two or more units45.6%San Diego city, California2019–2023
Operating relationshipmultifamily housing concentration
Calculation controls
Relationship maximum
3
City-condition strength
0.55
Operating exposure
0.3463
Evidence confidence
0.75
Provenance multiplier
1
Geographic applicability
1
Profile effect multiplier
0.9775
Eligibility weight
0.8
Effect before model controls
0.335075
Final effect
0.167538
Single-relationship cap
1
Modifier cap
1
Correlation control
0.5
Effect-family cap
1
Factor cap
1
Total local-movement cap
1
+0.13
Evidence confidence: ModerateSource [5] [3]
Local observationHousing in buildings with two or more units45.6%San Diego city, California2019–2023
Operating relationshipmultifamily housing concentration
Calculation controls
Relationship maximum
3
City-condition strength
0.55
Operating exposure
0.5487
Evidence confidence
0.75
Provenance multiplier
1
Geographic applicability
1
Profile effect multiplier
0.975
Eligibility weight
0.8
Effect before model controls
0.529681
Final effect
0.13242
Single-relationship cap
1
Modifier cap
1
Correlation control
0.25
Effect-family cap
1
Factor cap
1
Total local-movement cap
1
Median owner-occupied home valueHigh homeowner property-value and equity capacitySan Diego city, California
0.00
Source [1] [2]
Local observationMedian owner-occupied home value$906,700San Diego city, California2020–2024
Operating relationshipHigh homeowner property-value and equity capacity
+0.46
Evidence confidence: HighSource [1] [2]
Local observationMedian owner-occupied home value$906,700San Diego city, California2020–2024
Operating relationshipHigh homeowner property-value and equity capacity
Calculation controls
Relationship maximum
3
City-condition strength
0.85
Operating exposure
0.2286
Evidence confidence
1
Provenance multiplier
1
Geographic applicability
1
Profile effect multiplier
0.9825
Eligibility weight
0.8
Effect before model controls
0.458126
Final effect
0.458126
Single-relationship cap
1
Modifier cap
1
Correlation control
1
Effect-family cap
1
Factor cap
1
Total local-movement cap
1
+0.46
Evidence confidence: HighSource [1] [2]
Local observationMedian owner-occupied home value$906,700San Diego city, California2020–2024
Operating relationshipHigh homeowner property-value and equity capacity
Calculation controls
Relationship maximum
3
City-condition strength
0.85
Operating exposure
0.2286
Evidence confidence
1
Provenance multiplier
1
Geographic applicability
1
Profile effect multiplier
0.98
Eligibility weight
0.8
Effect before model controls
0.45696
Final effect
0.45696
Single-relationship cap
1
Modifier cap
1
Correlation control
1
Effect-family cap
1
Factor cap
1
Total local-movement cap
1
+0.43
Evidence confidence: HighSource [1] [2]
Local observationMedian owner-occupied home value$906,700San Diego city, California2020–2024
Operating relationshipHigh homeowner property-value and equity capacity
Calculation controls
Relationship maximum
3
City-condition strength
0.85
Operating exposure
0.2143
Evidence confidence
1
Provenance multiplier
1
Geographic applicability
1
Profile effect multiplier
0.9775
Eligibility weight
0.8
Effect before model controls
0.427307
Final effect
0.427307
Single-relationship cap
1
Modifier cap
1
Correlation control
1
Effect-family cap
1
Factor cap
1
Total local-movement cap
1
+0.37
Evidence confidence: HighSource [1] [2]
Local observationMedian owner-occupied home value$906,700San Diego city, California2020–2024
Operating relationshipHigh homeowner property-value and equity capacity
Calculation controls
Relationship maximum
3
City-condition strength
0.85
Operating exposure
0.1857
Evidence confidence
1
Provenance multiplier
1
Geographic applicability
1
Profile effect multiplier
0.975
Eligibility weight
0.8
Effect before model controls
0.369386
Final effect
0.369386
Single-relationship cap
1
Modifier cap
1
Correlation control
1
Effect-family cap
1
Factor cap
1
Total local-movement cap
1
+0.37
Evidence confidence: HighSource [1] [2]
Local observationMedian owner-occupied home value$906,700San Diego city, California2020–2024
Operating relationshipHigh homeowner property-value and equity capacity
Calculation controls
Relationship maximum
3
City-condition strength
0.85
Operating exposure
0.1857
Evidence confidence
1
Provenance multiplier
1
Geographic applicability
1
Profile effect multiplier
0.975
Eligibility weight
0.8
Effect before model controls
0.369386
Final effect
0.369386
Single-relationship cap
1
Modifier cap
1
Correlation control
1
Effect-family cap
1
Factor cap
1
Total local-movement cap
1
+0.40
Evidence confidence: HighSource [1] [2]
Local observationMedian owner-occupied home value$906,700San Diego city, California2020–2024
Operating relationshipHigh homeowner property-value and equity capacity
Calculation controls
Relationship maximum
3
City-condition strength
0.85
Operating exposure
0.2
Evidence confidence
1
Provenance multiplier
1
Geographic applicability
1
Profile effect multiplier
0.9775
Eligibility weight
0.8
Effect before model controls
0.39882
Final effect
0.39882
Single-relationship cap
1
Modifier cap
1
Correlation control
1
Effect-family cap
1
Factor cap
1
Total local-movement cap
1
+0.31
Evidence confidence: HighSource [1] [2]
Local observationMedian owner-occupied home value$906,700San Diego city, California2020–2024
Operating relationshipHigh homeowner property-value and equity capacity
Calculation controls
Relationship maximum
3
City-condition strength
0.85
Operating exposure
0.1571
Evidence confidence
1
Provenance multiplier
1
Geographic applicability
1
Profile effect multiplier
0.98
Eligibility weight
0.8
Effect before model controls
0.31416
Final effect
0.31416
Single-relationship cap
1
Modifier cap
1
Correlation control
1
Effect-family cap
1
Factor cap
1
Total local-movement cap
1
Housing units permittedConstruction and renovation activitySan Diego city, California
+0.43
Evidence confidence: ModerateSource [6]
Local observationHousing units permitted8,782 housing unitsSan Diego city, California2024
Operating relationshipConstruction and renovation activity
Calculation controls
Relationship maximum
3
City-condition strength
0.55
Operating exposure
0.4412
Evidence confidence
0.75
Provenance multiplier
1
Geographic applicability
1
Profile effect multiplier
0.9775
Eligibility weight
0.8
Effect before model controls
0.426938
Final effect
0.426938
Single-relationship cap
1
Modifier cap
1
Correlation control
1
Effect-family cap
1
Factor cap
1
Total local-movement cap
1
+0.019212
Scored; below display thresholdEvidence confidence: ModerateSource [6]
Local observationHousing units permitted8,782 housing unitsSan Diego city, California2024
Operating relationshipConstruction and renovation activity
Calculation controls
Relationship maximum
3
City-condition strength
0.55
Operating exposure
0.0794
Evidence confidence
0.75
Provenance multiplier
1
Geographic applicability
1
Profile effect multiplier
0.9775
Eligibility weight
0.8
Effect before model controls
0.076849
Final effect
0.019212
Single-relationship cap
1
Modifier cap
1
Correlation control
0.25
Effect-family cap
1
Factor cap
1
Total local-movement cap
1
+0.015969
Scored; below display thresholdEvidence confidence: ModerateSource [6]
Local observationHousing units permitted8,782 housing unitsSan Diego city, California2024
Operating relationshipConstruction and renovation activity
Calculation controls
Relationship maximum
3
City-condition strength
0.55
Operating exposure
0.0662
Evidence confidence
0.75
Provenance multiplier
1
Geographic applicability
1
Profile effect multiplier
0.975
Eligibility weight
0.8
Effect before model controls
0.063877
Final effect
0.015969
Single-relationship cap
1
Modifier cap
1
Correlation control
0.25
Effect-family cap
1
Factor cap
1
Total local-movement cap
1
+0.07
Evidence confidence: ModerateSource [6]
Local observationHousing units permitted8,782 housing unitsSan Diego city, California2024
Operating relationshipConstruction and renovation activity
Calculation controls
Relationship maximum
3
City-condition strength
0.55
Operating exposure
0.1456
Evidence confidence
0.75
Provenance multiplier
1
Geographic applicability
1
Profile effect multiplier
0.9775
Eligibility weight
0.8
Effect before model controls
0.140889
Final effect
0.070444
Single-relationship cap
1
Modifier cap
1
Correlation control
0.5
Effect-family cap
1
Factor cap
1
Total local-movement cap
1
+0.015969
Scored; below display thresholdEvidence confidence: ModerateSource [6]
Local observationHousing units permitted8,782 housing unitsSan Diego city, California2024
Operating relationshipConstruction and renovation activity
Calculation controls
Relationship maximum
3
City-condition strength
0.55
Operating exposure
0.0662
Evidence confidence
0.75
Provenance multiplier
1
Geographic applicability
1
Profile effect multiplier
0.975
Eligibility weight
0.8
Effect before model controls
0.063877
Final effect
0.015969
Single-relationship cap
1
Modifier cap
1
Correlation control
0.25
Effect-family cap
1
Factor cap
1
Total local-movement cap
1
+0.009631
Scored; below display thresholdEvidence confidence: ModerateSource [6]
Local observationHousing units permitted8,782 housing unitsSan Diego city, California2024
Operating relationshipConstruction and renovation activity
Calculation controls
Relationship maximum
3
City-condition strength
0.55
Operating exposure
0.0397
Evidence confidence
0.75
Provenance multiplier
1
Geographic applicability
1
Profile effect multiplier
0.98
Eligibility weight
0.8
Effect before model controls
0.038523
Final effect
0.009631
Single-relationship cap
1
Modifier cap
1
Correlation control
0.25
Effect-family cap
1
Factor cap
1
Total local-movement cap
1
Population change since 2020Broad population and household growthSan Diego city, California
+0.26
Evidence confidence: HighSource [1] [2]
Local observationPopulation change since 20201.6%San Diego city, California2020–2025
Operating relationshippopulation and household growth
Calculation controls
Relationship maximum
3
City-condition strength
0.25
Operating exposure
0.4391
Evidence confidence
1
Provenance multiplier
1
Geographic applicability
1
Profile effect multiplier
0.9775
Eligibility weight
0.8
Effect before model controls
0.25755
Final effect
0.25755
Single-relationship cap
1
Modifier cap
1
Correlation control
1
Effect-family cap
1
Factor cap
1
Total local-movement cap
1
+0.22
Evidence confidence: HighSource [1] [2]
Local observationPopulation change since 20201.6%San Diego city, California2020–2025
Operating relationshippopulation and household growth
Calculation controls
Relationship maximum
3
City-condition strength
0.25
Operating exposure
0.3696
Evidence confidence
1
Provenance multiplier
1
Geographic applicability
1
Profile effect multiplier
0.975
Eligibility weight
0.8
Effect before model controls
0.216196
Final effect
0.216196
Single-relationship cap
1
Modifier cap
1
Correlation control
1
Effect-family cap
1
Factor cap
1
Total local-movement cap
1
+0.19
Evidence confidence: HighSource [1] [2]
Local observationPopulation change since 20201.6%San Diego city, California2020–2025
Operating relationshippopulation and household growth
Calculation controls
Relationship maximum
3
City-condition strength
0.25
Operating exposure
0.3239
Evidence confidence
1
Provenance multiplier
1
Geographic applicability
1
Profile effect multiplier
0.9775
Eligibility weight
0.8
Effect before model controls
0.189975
Final effect
0.189975
Single-relationship cap
1
Modifier cap
1
Correlation control
1
Effect-family cap
1
Factor cap
1
Total local-movement cap
1
+0.26
Evidence confidence: HighSource [1] [2]
Local observationPopulation change since 20201.6%San Diego city, California2020–2025
Operating relationshippopulation and household growth
Calculation controls
Relationship maximum
3
City-condition strength
0.25
Operating exposure
0.4391
Evidence confidence
1
Provenance multiplier
1
Geographic applicability
1
Profile effect multiplier
0.975
Eligibility weight
0.8
Effect before model controls
0.256891
Final effect
0.256891
Single-relationship cap
1
Modifier cap
1
Correlation control
1
Effect-family cap
1
Factor cap
1
Total local-movement cap
1
+0.06
Evidence confidence: HighSource [1] [2]
Local observationPopulation change since 20201.6%San Diego city, California2020–2025
Operating relationshippopulation and household growth
Calculation controls
Relationship maximum
3
City-condition strength
0.25
Operating exposure
0.1065
Evidence confidence
1
Provenance multiplier
1
Geographic applicability
1
Profile effect multiplier
0.9775
Eligibility weight
0.8
Effect before model controls
0.062475
Final effect
0.062475
Single-relationship cap
1
Modifier cap
1
Correlation control
1
Effect-family cap
1
Factor cap
1
Total local-movement cap
1
+0.33
Evidence confidence: HighSource [1] [2]
Local observationPopulation change since 20201.6%San Diego city, California2020–2025
Operating relationshippopulation and household growth
Calculation controls
Relationship maximum
3
City-condition strength
0.25
Operating exposure
0.5674
Evidence confidence
1
Provenance multiplier
1
Geographic applicability
1
Profile effect multiplier
0.975
Eligibility weight
0.8
Effect before model controls
0.331924
Final effect
0.331924
Single-relationship cap
1
Modifier cap
1
Correlation control
1
Effect-family cap
1
Factor cap
1
Total local-movement cap
1
+0.28
Evidence confidence: HighSource [1] [2]
Local observationPopulation change since 20201.6%San Diego city, California2020–2025
Operating relationshippopulation and household growth
Calculation controls
Relationship maximum
3
City-condition strength
0.25
Operating exposure
0.4826
Evidence confidence
1
Provenance multiplier
1
Geographic applicability
1
Profile effect multiplier
0.98
Eligibility weight
0.8
Effect before model controls
0.283774
Final effect
0.283774
Single-relationship cap
1
Modifier cap
1
Correlation control
1
Effect-family cap
1
Factor cap
1
Total local-movement cap
1
+0.06
Evidence confidence: HighSource [1] [2]
Local observationPopulation change since 20201.6%San Diego city, California2020–2025
Operating relationshippopulation and household growth
Calculation controls
Relationship maximum
3
City-condition strength
0.25
Operating exposure
0.0989
Evidence confidence
1
Provenance multiplier
1
Geographic applicability
1
Profile effect multiplier
0.9775
Eligibility weight
0.8
Effect before model controls
0.058013
Final effect
0.058013
Single-relationship cap
1
Modifier cap
1
Correlation control
1
Effect-family cap
1
Factor cap
1
Total local-movement cap
1
Detached single-family housing shareLow detached single-family housing shareSan Diego city, California
-0.09
Evidence confidence: ModerateSource [5] [3]
Local observationDetached single-family housing share43.5%San Diego city, California2019–2023
Operating relationshipLow detached single-family housing share
Calculation controls
Relationship maximum
3
City-condition strength
0.55
Operating exposure
0.3
Evidence confidence
0.75
Provenance multiplier
1
Geographic applicability
1
Profile effect multiplier
0.9775
Eligibility weight
1
Effect before model controls
-0.362897
Final effect
-0.090724
Single-relationship cap
1
Modifier cap
1
Correlation control
0.25
Effect-family cap
1
Factor cap
1
Total local-movement cap
1
-0.09
Evidence confidence: ModerateSource [5] [3]
Local observationDetached single-family housing share43.5%San Diego city, California2019–2023
Operating relationshipLow detached single-family housing share
Calculation controls
Relationship maximum
3
City-condition strength
0.55
Operating exposure
0.3
Evidence confidence
0.75
Provenance multiplier
1
Geographic applicability
1
Profile effect multiplier
0.975
Eligibility weight
1
Effect before model controls
-0.361969
Final effect
-0.090492
Single-relationship cap
1
Modifier cap
1
Correlation control
0.25
Effect-family cap
1
Factor cap
1
Total local-movement cap
1
-0.18
Evidence confidence: ModerateSource [5] [3]
Local observationDetached single-family housing share43.5%San Diego city, California2019–2023
Operating relationshipLow detached single-family housing share
Calculation controls
Relationship maximum
3
City-condition strength
0.55
Operating exposure
0.3
Evidence confidence
0.75
Provenance multiplier
1
Geographic applicability
1
Profile effect multiplier
0.975
Eligibility weight
1
Effect before model controls
-0.361969
Final effect
-0.180984
Single-relationship cap
1
Modifier cap
1
Correlation control
0.5
Effect-family cap
1
Factor cap
1
Total local-movement cap
1
-0.30
Evidence confidence: ModerateSource [5] [3]
Local observationDetached single-family housing share43.5%San Diego city, California2019–2023
Operating relationshipLow detached single-family housing share
Calculation controls
Relationship maximum
3
City-condition strength
0.55
Operating exposure
0.5
Evidence confidence
0.75
Provenance multiplier
1
Geographic applicability
1
Profile effect multiplier
0.975
Eligibility weight
1
Effect before model controls
-0.603281
Final effect
-0.30164
Single-relationship cap
1
Modifier cap
1
Correlation control
0.5
Effect-family cap
1
Factor cap
1
Total local-movement cap
1
-0.15
Evidence confidence: ModerateSource [5] [3]
Local observationDetached single-family housing share43.5%San Diego city, California2019–2023
Operating relationshipLow detached single-family housing share
Calculation controls
Relationship maximum
3
City-condition strength
0.55
Operating exposure
0.25
Evidence confidence
0.75
Provenance multiplier
1
Geographic applicability
1
Profile effect multiplier
0.98
Eligibility weight
1
Effect before model controls
-0.303187
Final effect
-0.151593
Single-relationship cap
1
Modifier cap
1
Correlation control
0.5
Effect-family cap
1
Factor cap
1
Total local-movement cap
1
Hotel rooms in City of San DiegoHotel and lodging activity concentrationSan Diego city, California
+0.13
Evidence confidence: ModerateSource [20]
Local observationHotel rooms in City of San Diego40,158 hotel roomsSan Diego city, California2025
Operating relationshiphospitality and lodging concentration
Calculation controls
Relationship maximum
3
City-condition strength
0.4
Operating exposure
0.3691
Evidence confidence
0.75
Provenance multiplier
1
Geographic applicability
1
Profile effect multiplier
0.9775
Eligibility weight
0.8
Effect before model controls
0.259785
Final effect
0.129892
Single-relationship cap
1
Modifier cap
1
Correlation control
0.5
Effect-family cap
1
Factor cap
1
Total local-movement cap
1
+0.009033
Scored; below display thresholdEvidence confidence: ModerateSource [20]
Local observationHotel rooms in City of San Diego40,158 hotel roomsSan Diego city, California2025
Operating relationshiphospitality and lodging concentration
Calculation controls
Relationship maximum
3
City-condition strength
0.4
Operating exposure
0.0515
Evidence confidence
0.75
Provenance multiplier
1
Geographic applicability
1
Profile effect multiplier
0.975
Eligibility weight
0.8
Effect before model controls
0.036132
Final effect
0.009033
Single-relationship cap
1
Modifier cap
1
Correlation control
0.25
Effect-family cap
1
Factor cap
1
Total local-movement cap
1
Healthcare and social assistance receiptsSan Diego city, California
+0.045069
Scored; below display thresholdEvidence confidence: ModerateSource [1]
Local observationHealthcare and social assistance receipts$22.747 billionSan Diego city, California2022
Operating relationshipsignage and graphics demand from healthcare facilities
Calculation controls
Relationship maximum
4
City-condition strength
0.25
Operating exposure
0.3074
Evidence confidence
0.75
Provenance multiplier
0.5
Geographic applicability
1
Profile effect multiplier
0.9775
Eligibility weight
0.8
Effect before model controls
0.090138
Final effect
0.045069
Single-relationship cap
1
Modifier cap
1
Correlation control
0.5
Effect-family cap
1
Factor cap
1
Total local-movement cap
1
+0.023556
Scored; below display thresholdEvidence confidence: ModerateSource [1]
Local observationHealthcare and social assistance receipts$22.747 billionSan Diego city, California2022
Operating relationshipDemand from healthcare facilities
Calculation controls
Relationship maximum
4
City-condition strength
0.25
Operating exposure
0.1598
Evidence confidence
0.75
Provenance multiplier
0.5
Geographic applicability
1
Profile effect multiplier
0.9825
Eligibility weight
0.8
Effect before model controls
0.047112
Final effect
0.023556
Single-relationship cap
1
Modifier cap
1
Correlation control
0.5
Effect-family cap
1
Factor cap
1
Total local-movement cap
1
+0.06
Evidence confidence: ModerateSource [1]
Local observationHealthcare and social assistance receipts$22.747 billionSan Diego city, California2022
Operating relationshipfacility-services demand from healthcare properties
Calculation controls
Relationship maximum
4
City-condition strength
0.25
Operating exposure
0.7623
Evidence confidence
0.75
Provenance multiplier
0.5
Geographic applicability
1
Profile effect multiplier
0.9775
Eligibility weight
0.8
Effect before model controls
0.223543
Final effect
0.055886
Single-relationship cap
1
Modifier cap
1
Correlation control
0.25
Effect-family cap
1
Factor cap
1
Total local-movement cap
1
+0.021688
Scored; below display thresholdEvidence confidence: ModerateSource [1]
Local observationHealthcare and social assistance receipts$22.747 billionSan Diego city, California2022
Operating relationshipDemand from healthcare facilities
Calculation controls
Relationship maximum
4
City-condition strength
0.25
Operating exposure
0.1475
Evidence confidence
0.75
Provenance multiplier
0.5
Geographic applicability
1
Profile effect multiplier
0.98
Eligibility weight
0.8
Effect before model controls
0.043377
Final effect
0.021688
Single-relationship cap
1
Modifier cap
1
Correlation control
0.5
Effect-family cap
1
Factor cap
1
Total local-movement cap
1
+0.012887
Scored; below display thresholdEvidence confidence: ModerateSource [1]
Local observationHealthcare and social assistance receipts$22.747 billionSan Diego city, California2022
Operating relationshipDemand from healthcare facilities
Calculation controls
Relationship maximum
4
City-condition strength
0.25
Operating exposure
0.1762
Evidence confidence
0.75
Provenance multiplier
0.5
Geographic applicability
1
Profile effect multiplier
0.975
Eligibility weight
0.8
Effect before model controls
0.051547
Final effect
0.012887
Single-relationship cap
1
Modifier cap
1
Correlation control
0.25
Effect-family cap
1
Factor cap
1
Total local-movement cap
1
+0.047351
Scored; below display thresholdEvidence confidence: ModerateSource [1]
Local observationHealthcare and social assistance receipts$22.747 billionSan Diego city, California2022
Operating relationshipDemand from healthcare facilities
Calculation controls
Relationship maximum
4
City-condition strength
0.25
Operating exposure
0.3238
Evidence confidence
0.75
Provenance multiplier
0.5
Geographic applicability
1
Profile effect multiplier
0.975
Eligibility weight
0.8
Effect before model controls
0.094703
Final effect
0.047351
Single-relationship cap
1
Modifier cap
1
Correlation control
0.5
Effect-family cap
1
Factor cap
1
Total local-movement cap
1
Food establishments in FEWD programRestaurant and commercial-foodservice account densitySan Diego city, California
+0.05
Evidence confidence: HighSource [17]
Local observationFood establishments in FEWD programMore than 5,000 permitted facilitiesSan Diego city, CaliforniaCurrent 2026
Operating relationshipRestaurant and commercial-foodservice account density
Calculation controls
Relationship maximum
3
City-condition strength
0.4
Operating exposure
0.1163
Evidence confidence
1
Provenance multiplier
1
Geographic applicability
1
Profile effect multiplier
0.975
Eligibility weight
0.8
Effect before model controls
0.108837
Final effect
0.054419
Single-relationship cap
1
Modifier cap
1
Correlation control
0.5
Effect-family cap
1
Factor cap
1
Total local-movement cap
1
Management employment shareProfessional and office-worker concentrationSan Diego-Chula Vista-Carlsbad MSA
+0.045411
Scored; below display thresholdEvidence confidence: HighSource [8]
Local observationManagement employment share7.6%San Diego-Chula Vista-Carlsbad MSAMay 2025
Operating relationshipProfessional and office-worker concentration
Calculation controls
Relationship maximum
3
City-condition strength
0.25
Operating exposure
0.1721
Evidence confidence
1
Provenance multiplier
0.5
Geographic applicability
0.9
Profile effect multiplier
0.9775
Eligibility weight
0.8
Effect before model controls
0.045411
Final effect
0.045411
Single-relationship cap
1
Modifier cap
1
Correlation control
1
Effect-family cap
1
Factor cap
1
Total local-movement cap
1
Renter-occupied housing shareHigh renter-household concentrationSan Diego city, California
+0.03629
Scored; below display thresholdEvidence confidence: ModerateSource [5] [2]
Local observationRenter-occupied housing share52.4%San Diego city, California2019–2023
Operating relationshiprenter-oriented residential demand
Calculation controls
Relationship maximum
3
City-condition strength
0.55
Operating exposure
0.075
Evidence confidence
0.75
Provenance multiplier
1
Geographic applicability
1
Profile effect multiplier
0.9775
Eligibility weight
0.8
Effect before model controls
0.072579
Final effect
0.03629
Single-relationship cap
1
Modifier cap
1
Correlation control
0.5
Effect-family cap
1
Factor cap
1
Total local-movement cap
1
+0.031916
Scored; below display thresholdEvidence confidence: ModerateSource [5] [2]
Local observationRenter-occupied housing share52.4%San Diego city, California2019–2023
Operating relationshiprenter-oriented residential demand
Calculation controls
Relationship maximum
3
City-condition strength
0.55
Operating exposure
0.1312
Evidence confidence
0.75
Provenance multiplier
1
Geographic applicability
1
Profile effect multiplier
0.9825
Eligibility weight
0.8
Effect before model controls
0.127664
Final effect
0.031916
Single-relationship cap
1
Modifier cap
1
Correlation control
0.25
Effect-family cap
1
Factor cap
1
Total local-movement cap
1
+0.031835
Scored; below display thresholdEvidence confidence: ModerateSource [5] [2]
Local observationRenter-occupied housing share52.4%San Diego city, California2019–2023
Operating relationshiprenter-oriented residential demand
Calculation controls
Relationship maximum
3
City-condition strength
0.55
Operating exposure
0.1312
Evidence confidence
0.75
Provenance multiplier
1
Geographic applicability
1
Profile effect multiplier
0.98
Eligibility weight
0.8
Effect before model controls
0.127339
Final effect
0.031835
Single-relationship cap
1
Modifier cap
1
Correlation control
0.25
Effect-family cap
1
Factor cap
1
Total local-movement cap
1
+0.022681
Scored; below display thresholdEvidence confidence: ModerateSource [5] [2]
Local observationRenter-occupied housing share52.4%San Diego city, California2019–2023
Operating relationshiprenter-oriented residential demand
Calculation controls
Relationship maximum
3
City-condition strength
0.55
Operating exposure
0.0937
Evidence confidence
0.75
Provenance multiplier
1
Geographic applicability
1
Profile effect multiplier
0.9775
Eligibility weight
0.8
Effect before model controls
0.090724
Final effect
0.022681
Single-relationship cap
1
Modifier cap
1
Correlation control
0.25
Effect-family cap
1
Factor cap
1
Total local-movement cap
1
+0.036197
Scored; below display thresholdEvidence confidence: ModerateSource [5] [2]
Local observationRenter-occupied housing share52.4%San Diego city, California2019–2023
Operating relationshiprenter-oriented residential demand
Calculation controls
Relationship maximum
3
City-condition strength
0.55
Operating exposure
0.15
Evidence confidence
0.75
Provenance multiplier
1
Geographic applicability
1
Profile effect multiplier
0.975
Eligibility weight
0.8
Effect before model controls
0.144787
Final effect
0.036197
Single-relationship cap
1
Modifier cap
1
Correlation control
0.25
Effect-family cap
1
Factor cap
1
Total local-movement cap
1
+0.027217
Scored; below display thresholdEvidence confidence: ModerateSource [5] [2]
Local observationRenter-occupied housing share52.4%San Diego city, California2019–2023
Operating relationshiprenter-oriented residential demand
Calculation controls
Relationship maximum
3
City-condition strength
0.55
Operating exposure
0.1125
Evidence confidence
0.75
Provenance multiplier
1
Geographic applicability
1
Profile effect multiplier
0.9775
Eligibility weight
0.8
Effect before model controls
0.108869
Final effect
0.027217
Single-relationship cap
1
Modifier cap
1
Correlation control
0.25
Effect-family cap
1
Factor cap
1
Total local-movement cap
1
+0.031672
Scored; below display thresholdEvidence confidence: ModerateSource [5] [2]
Local observationRenter-occupied housing share52.4%San Diego city, California2019–2023
Operating relationshiprenter-oriented residential demand
Calculation controls
Relationship maximum
3
City-condition strength
0.55
Operating exposure
0.1312
Evidence confidence
0.75
Provenance multiplier
1
Geographic applicability
1
Profile effect multiplier
0.975
Eligibility weight
0.8
Effect before model controls
0.126689
Final effect
0.031672
Single-relationship cap
1
Modifier cap
1
Correlation control
0.25
Effect-family cap
1
Factor cap
1
Total local-movement cap
1
Transportation and warehousing receiptsFreight, warehousing and logistics activitySan Diego city, California
+0.012606
Scored; below display thresholdEvidence confidence: ModerateSource [1]
Local observationTransportation and warehousing receipts$4.797 billionSan Diego city, California2022
Operating relationshipFreight, warehousing and logistics activity
Calculation controls
Relationship maximum
3
City-condition strength
0.4
Operating exposure
0.1592
Evidence confidence
0.75
Provenance multiplier
0.5
Geographic applicability
0.9
Profile effect multiplier
0.9775
Eligibility weight
0.8
Effect before model controls
0.050424
Final effect
0.012606
Single-relationship cap
1
Modifier cap
1
Correlation control
0.25
Effect-family cap
1
Factor cap
1
Total local-movement cap
1
Customer demand — Factor subtotal+1.52+1.29+0.95+0.69+0.31+0.52+0.20+0.23+0.26
+0.01
Scored; below display thresholdFinal effect: +0.0109
-0.21-0.33-0.83
Building energy requirementsCity of San Diego covered buildings
+0.25
Evidence confidence: HighSource [44]
Local observationAnnual building-energy benchmarking filing deadlineJune 1 annuallyCity of San Diego covered buildings2026 cycle
Operating relationshipHVAC efficiency-upgrade demand
Calculation controls
Relationship maximum
4
City-condition strength
0.25
Operating exposure
0.32
Evidence confidence
1
Provenance multiplier
1
Geographic applicability
1
Profile effect multiplier
0.9775
Eligibility weight
0.8
Effect before model controls
0.25024
Final effect
0.25024
Single-relationship cap
1
Modifier cap
1
Correlation control
1
Effect-family cap
1
Factor cap
1
Total local-movement cap
1
+0.22
Evidence confidence: HighSource [44]
Local observationAnnual building-energy benchmarking filing deadlineJune 1 annuallyCity of San Diego covered buildings2026 cycle
Operating relationshipelectrical upgrade demand
Calculation controls
Relationship maximum
4
City-condition strength
0.25
Operating exposure
0.28
Evidence confidence
1
Provenance multiplier
1
Geographic applicability
1
Profile effect multiplier
0.98
Eligibility weight
0.8
Effect before model controls
0.21952
Final effect
0.21952
Single-relationship cap
1
Modifier cap
1
Correlation control
1
Effect-family cap
1
Factor cap
1
Total local-movement cap
1
Older building stockSan Diego city, California
+0.12
Evidence confidence: ModerateSource [5]
Local observationMedian year built1978San Diego city, California2019–2023
Operating relationshiprepair and replacement demand
Calculation controls
Relationship maximum
5.5
City-condition strength
0.4
Operating exposure
0.1899
Evidence confidence
0.75
Provenance multiplier
1
Geographic applicability
1
Profile effect multiplier
0.9825
Eligibility weight
0.8
Effect before model controls
0.246247
Final effect
0.123123
Single-relationship cap
1
Modifier cap
1
Correlation control
0.5
Effect-family cap
1
Factor cap
1
Total local-movement cap
1
+0.12
Evidence confidence: ModerateSource [5]
Local observationMedian year built1978San Diego city, California2019–2023
Operating relationshiprepair and replacement demand
Calculation controls
Relationship maximum
5.5
City-condition strength
0.4
Operating exposure
0.1899
Evidence confidence
0.75
Provenance multiplier
1
Geographic applicability
1
Profile effect multiplier
0.98
Eligibility weight
0.8
Effect before model controls
0.24562
Final effect
0.12281
Single-relationship cap
1
Modifier cap
1
Correlation control
0.5
Effect-family cap
1
Factor cap
1
Total local-movement cap
1
+0.15
Evidence confidence: ModerateSource [5]
Local observationMedian year built1978San Diego city, California2019–2023
Operating relationshipHVAC repair and replacement demand
Calculation controls
Relationship maximum
5.5
City-condition strength
0.4
Operating exposure
0.2278
Evidence confidence
0.75
Provenance multiplier
1
Geographic applicability
1
Profile effect multiplier
0.9775
Eligibility weight
0.8
Effect before model controls
0.293992
Final effect
0.146996
Single-relationship cap
1
Modifier cap
1
Correlation control
0.5
Effect-family cap
1
Factor cap
1
Total local-movement cap
1
+0.16
Evidence confidence: ModerateSource [5]
Local observationMedian year built1978San Diego city, California2019–2023
Operating relationshipplumbing and drain repair demand
Calculation controls
Relationship maximum
5.5
City-condition strength
0.4
Operating exposure
0.2532
Evidence confidence
0.75
Provenance multiplier
1
Geographic applicability
1
Profile effect multiplier
0.975
Eligibility weight
0.8
Effect before model controls
0.325823
Final effect
0.162911
Single-relationship cap
1
Modifier cap
1
Correlation control
0.5
Effect-family cap
1
Factor cap
1
Total local-movement cap
1
+0.15
Evidence confidence: ModerateSource [5]
Local observationMedian year built1978San Diego city, California2019–2023
Operating relationshiprepair and replacement demand
Calculation controls
Relationship maximum
5.5
City-condition strength
0.4
Operating exposure
0.1139
Evidence confidence
0.75
Provenance multiplier
1
Geographic applicability
1
Profile effect multiplier
0.9775
Eligibility weight
0.8
Effect before model controls
0.146996
Final effect
0.146996
Single-relationship cap
1
Modifier cap
1
Correlation control
1
Effect-family cap
1
Factor cap
1
Total local-movement cap
1
+0.16
Evidence confidence: ModerateSource [5]
Local observationMedian year built1978San Diego city, California2019–2023
Operating relationshipplumbing and drain repair demand
Calculation controls
Relationship maximum
5.5
City-condition strength
0.4
Operating exposure
0.2532
Evidence confidence
0.75
Provenance multiplier
1
Geographic applicability
1
Profile effect multiplier
0.975
Eligibility weight
0.8
Effect before model controls
0.325823
Final effect
0.162911
Single-relationship cap
1
Modifier cap
1
Correlation control
0.5
Effect-family cap
1
Factor cap
1
Total local-movement cap
1
+0.14
Evidence confidence: ModerateSource [5]
Local observationMedian year built1978San Diego city, California2019–2023
Operating relationshipelectrical repair and upgrade demand
Calculation controls
Relationship maximum
5.5
City-condition strength
0.4
Operating exposure
0.2152
Evidence confidence
0.75
Provenance multiplier
1
Geographic applicability
1
Profile effect multiplier
0.98
Eligibility weight
0.8
Effect before model controls
0.27837
Final effect
0.139185
Single-relationship cap
1
Modifier cap
1
Correlation control
0.5
Effect-family cap
1
Factor cap
1
Total local-movement cap
1
Repair and replacement demand — Factor subtotal+0.12+0.12+0.40+0.16+0.15+0.16+0.36
Local competition — Factor subtotal
Installation, maintenance and repair mean hourly wageHigh local occupational wage cost environmentSan Diego-Chula Vista-Carlsbad MSA
-0.18
Evidence confidence: HighSource [8]
Local observationInstallation, maintenance and repair mean hourly wage$33.23/hourSan Diego-Chula Vista-Carlsbad MSAMay 2025
Operating relationshiphigher local labor costs
Calculation controls
Relationship maximum
3
City-condition strength
0.4
Operating exposure
0.1704
Evidence confidence
1
Provenance multiplier
1
Geographic applicability
0.9
Profile effect multiplier
0.9775
Eligibility weight
1
Effect before model controls
-0.179886
Final effect
-0.179886
Single-relationship cap
1
Modifier cap
1
Correlation control
1
Effect-family cap
1
Factor cap
1
Total local-movement cap
1
-0.27
Evidence confidence: HighSource [8]
Local observationInstallation, maintenance and repair mean hourly wage$33.23/hourSan Diego-Chula Vista-Carlsbad MSAMay 2025
Operating relationshiphigher local labor costs
Calculation controls
Relationship maximum
3
City-condition strength
0.4
Operating exposure
0.2586
Evidence confidence
1
Provenance multiplier
1
Geographic applicability
0.9
Profile effect multiplier
0.9825
Eligibility weight
1
Effect before model controls
-0.27435
Final effect
-0.27435
Single-relationship cap
1
Modifier cap
1
Correlation control
1
Effect-family cap
1
Factor cap
1
Total local-movement cap
1
-0.10
Evidence confidence: HighSource [8]
Local observationConstruction and extraction mean hourly wage$36.54/hourSan Diego-Chula Vista-Carlsbad MSAMay 2025
Operating relationshiphigher local labor costs
Calculation controls
Relationship maximum
3
City-condition strength
0.4
Operating exposure
0.0954
Evidence confidence
1
Provenance multiplier
1
Geographic applicability
0.9
Profile effect multiplier
0.9775
Eligibility weight
1
Effect before model controls
-0.100708
Final effect
-0.100708
Single-relationship cap
1
Modifier cap
1
Correlation control
1
Effect-family cap
1
Factor cap
1
Total local-movement cap
1
-0.27
Evidence confidence: HighSource [8]
Local observationInstallation, maintenance and repair mean hourly wage$33.23/hourSan Diego-Chula Vista-Carlsbad MSAMay 2025
Operating relationshiphigher local labor costs
Calculation controls
Relationship maximum
3
City-condition strength
0.4
Operating exposure
0.2586
Evidence confidence
1
Provenance multiplier
1
Geographic applicability
0.9
Profile effect multiplier
0.98
Eligibility weight
1
Effect before model controls
-0.273652
Final effect
-0.273652
Single-relationship cap
1
Modifier cap
1
Correlation control
1
Effect-family cap
1
Factor cap
1
Total local-movement cap
1
-0.41
Evidence confidence: HighSource [8]
Local observationConstruction and extraction mean hourly wage$36.54/hourSan Diego-Chula Vista-Carlsbad MSAMay 2025
Operating relationshiphigher local labor costs
Calculation controls
Relationship maximum
3
City-condition strength
0.4
Operating exposure
0.3888
Evidence confidence
1
Provenance multiplier
1
Geographic applicability
0.9
Profile effect multiplier
0.9775
Eligibility weight
1
Effect before model controls
-0.410473
Final effect
-0.410473
Single-relationship cap
1
Modifier cap
1
Correlation control
1
Effect-family cap
1
Factor cap
1
Total local-movement cap
1
-0.40
Evidence confidence: HighSource [8]
Local observationConstruction and extraction mean hourly wage$36.54/hourSan Diego-Chula Vista-Carlsbad MSAMay 2025
Operating relationshiphigher local labor costs
Calculation controls
Relationship maximum
3
City-condition strength
0.4
Operating exposure
0.3783
Evidence confidence
1
Provenance multiplier
1
Geographic applicability
0.9
Profile effect multiplier
0.975
Eligibility weight
1
Effect before model controls
-0.398339
Final effect
-0.398339
Single-relationship cap
1
Modifier cap
1
Correlation control
1
Effect-family cap
1
Factor cap
1
Total local-movement cap
1
-0.29
Evidence confidence: HighSource [8]
Local observationConstruction and extraction mean hourly wage$36.54/hourSan Diego-Chula Vista-Carlsbad MSAMay 2025
Operating relationshiphigher local labor costs
Calculation controls
Relationship maximum
3
City-condition strength
0.4
Operating exposure
0.2783
Evidence confidence
1
Provenance multiplier
1
Geographic applicability
0.9
Profile effect multiplier
0.9775
Eligibility weight
1
Effect before model controls
-0.29379
Final effect
-0.29379
Single-relationship cap
1
Modifier cap
1
Correlation control
1
Effect-family cap
1
Factor cap
1
Total local-movement cap
1
-0.40
Evidence confidence: HighSource [8]
Local observationConstruction and extraction mean hourly wage$36.54/hourSan Diego-Chula Vista-Carlsbad MSAMay 2025
Operating relationshiphigher local labor costs
Calculation controls
Relationship maximum
3
City-condition strength
0.4
Operating exposure
0.3789
Evidence confidence
1
Provenance multiplier
1
Geographic applicability
0.9
Profile effect multiplier
0.975
Eligibility weight
1
Effect before model controls
-0.399032
Final effect
-0.399032
Single-relationship cap
1
Modifier cap
1
Correlation control
1
Effect-family cap
1
Factor cap
1
Total local-movement cap
1
-0.15
Evidence confidence: HighSource [8]
Local observationInstallation, maintenance and repair mean hourly wage$33.23/hourSan Diego-Chula Vista-Carlsbad MSAMay 2025
Operating relationshiphigher local labor costs
Calculation controls
Relationship maximum
3
City-condition strength
0.4
Operating exposure
0.1414
Evidence confidence
1
Provenance multiplier
1
Geographic applicability
0.9
Profile effect multiplier
0.9775
Eligibility weight
1
Effect before model controls
-0.149326
Final effect
-0.149326
Single-relationship cap
1
Modifier cap
1
Correlation control
1
Effect-family cap
1
Factor cap
1
Total local-movement cap
1
-0.34
Evidence confidence: HighSource [8]
Local observationConstruction and extraction mean hourly wage$36.54/hourSan Diego-Chula Vista-Carlsbad MSAMay 2025
Operating relationshiphigher local labor costs
Calculation controls
Relationship maximum
3
City-condition strength
0.4
Operating exposure
0.325
Evidence confidence
1
Provenance multiplier
1
Geographic applicability
0.9
Profile effect multiplier
0.98
Eligibility weight
1
Effect before model controls
-0.34398
Final effect
-0.34398
Single-relationship cap
1
Modifier cap
1
Correlation control
1
Effect-family cap
1
Factor cap
1
Total local-movement cap
1
Healthcare support employment shareStrong frontline labor supplySan Diego-Chula Vista-Carlsbad MSA
+0.10
Evidence confidence: HighSource [8]
Local observationHealthcare support employment share5.9%San Diego-Chula Vista-Carlsbad MSAMay 2025
Operating relationshipStrong frontline labor supply
Calculation controls
Relationship maximum
3
City-condition strength
0.4
Operating exposure
0.2444
Evidence confidence
1
Provenance multiplier
0.5
Geographic applicability
0.9
Profile effect multiplier
0.975
Eligibility weight
0.8
Effect before model controls
0.10296
Final effect
0.10296
Single-relationship cap
1
Modifier cap
1
Correlation control
1
Effect-family cap
1
Factor cap
1
Total local-movement cap
1
+0.10
Evidence confidence: HighSource [8]
Local observationHealthcare support employment share5.9%San Diego-Chula Vista-Carlsbad MSAMay 2025
Operating relationshipStrong frontline labor supply
Calculation controls
Relationship maximum
3
City-condition strength
0.4
Operating exposure
0.2444
Evidence confidence
1
Provenance multiplier
0.5
Geographic applicability
0.9
Profile effect multiplier
0.9775
Eligibility weight
0.8
Effect before model controls
0.103224
Final effect
0.103224
Single-relationship cap
1
Modifier cap
1
Correlation control
1
Effect-family cap
1
Factor cap
1
Total local-movement cap
1
Hiring and staffing conditions — Factor subtotal-0.18-0.27-0.10-0.27-0.41-0.40-0.29-0.40-0.15+0.10-0.34+0.10
Driving, routing, and parking — Factor subtotal
Finding and operating the right location — Factor subtotal
Winning new customers — Factor subtotal
Referral channels — Factor subtotal
Territory conditions — Factor subtotal
SDG&E small-commercial average electric rateBroad utility-rate pressureSDG&E electric service area
-1.28
Largest driverRelationship test: Rank stays #13 without this driver.Evidence confidence: ModerateSource [18] [19]
Local observationSDG&E small-commercial average electric rate39.276 cents/kWhSDG&E electric service areaJanuary 1, 2026
Operating relationshipBroad utility-rate pressure
Calculation controls
Relationship maximum
3
City-condition strength
0.7
Operating exposure
0.8333
Evidence confidence
0.75
Provenance multiplier
1
Geographic applicability
1
Profile effect multiplier
0.9775
Eligibility weight
1
Effect before model controls
-1.282969
Final effect
-1.282969
Single-relationship cap
1
Modifier cap
1
Correlation control
1
Effect-family cap
1
Factor cap
1
Total local-movement cap
1
Statutory minimum wageCitywide statutory wage floorSan Diego city, California
-0.13
Evidence confidence: HighSource [11] [12]
Local observationStatutory minimum wage$17.75/hourSan Diego city, California2026
Operating relationshipCitywide statutory wage floor
Calculation controls
Relationship maximum
3
City-condition strength
0.25
Operating exposure
0.1774
Evidence confidence
1
Provenance multiplier
1
Geographic applicability
1
Profile effect multiplier
0.975
Eligibility weight
1
Effect before model controls
-0.129738
Final effect
-0.129738
Single-relationship cap
1
Modifier cap
1
Correlation control
1
Effect-family cap
1
Factor cap
1
Total local-movement cap
1
-0.13
Evidence confidence: HighSource [11] [12]
Local observationStatutory minimum wage$17.75/hourSan Diego city, California2026
Operating relationshipCitywide statutory wage floor
Calculation controls
Relationship maximum
3
City-condition strength
0.25
Operating exposure
0.1774
Evidence confidence
1
Provenance multiplier
1
Geographic applicability
1
Profile effect multiplier
0.9775
Eligibility weight
1
Effect before model controls
-0.130071
Final effect
-0.130071
Single-relationship cap
1
Modifier cap
1
Correlation control
1
Effect-family cap
1
Factor cap
1
Total local-movement cap
1
Water rate increase effective January 1, 2026Broad utility-rate pressureCity of San Diego Public Utilities water service area
-0.13
Evidence confidence: HighSource [15]
Local observationWater rate increase effective January 1, 202614.7%City of San Diego Public Utilities water service area2026
Operating relationshipBroad utility-rate pressure
Calculation controls
Relationship maximum
3
City-condition strength
0.25
Operating exposure
0.3462
Evidence confidence
1
Provenance multiplier
1
Geographic applicability
1
Profile effect multiplier
0.9775
Eligibility weight
1
Effect before model controls
-0.253774
Final effect
-0.126887
Single-relationship cap
1
Modifier cap
1
Correlation control
0.5
Effect-family cap
1
Factor cap
1
Total local-movement cap
1
Model adjustmentNot local evidence
-0.10
Model adjustmentNot local evidence
Calculation controls
Relationship maximum
0.1
City-condition strength
1
Operating exposure
1
Evidence confidence
1
Provenance multiplier
1
Geographic applicability
1
Profile effect multiplier
1
Eligibility weight
1
Effect before model controls
-0.1
Final effect
-0.1
Single-relationship cap
1
Modifier cap
1
Correlation control
1
Effect-family cap
1
Factor cap
1
Total local-movement cap
1
Local rules and operating requirements — Factor subtotal-0.10-0.13-1.54
Advantages+1.52+1.66+0.95+1.30+1.52+1.50+0.20+1.10+1.33+0.66+1.00+1.07+0.16
Constraints-0.18-0.52-0.10-0.76-1.23-1.21-0.10-1.02-1.30-0.79-1.24-1.38-2.43
Net local movement+1.340+1.141+0.850+0.542+0.296+0.287+0.096+0.085+0.028-0.138-0.237-0.314-2.270
Full-precision calculated score71.33954271.14054670.84994770.54223970.29554470.28677170.09635070.08529070.02764869.86157469.76310069.68623267.730194
Published local fit71.3471.1470.8570.5470.3070.2970.1070.0970.0369.8669.7669.6967.73

Factor calculations use full precision. Factor totals and published scores are displayed to two decimal places; ranking order uses the full-precision score.

#171.34

FASTSIGNS

Initial investment: $231,226–$386,285

Advantage +0.67 pts Military installation scaleConstraint -0.18 pts Installation, maintenance and repair mean hourly wage

Rank sensitivity: Highly sensitive (#1–#12 in distinct rank tests)

Candidate-specific considerations (1)

Not included in this score

Potential candidate constraint

Institutional procurement and vendor-onboarding friction

Referral channels
Evidence confidence: HighSource [35] [36]San Diego institutional procurement environment
Operating relationshipInstitutional procurement and vendor-onboarding friction
City and port bidder enrollment only apply when pursuing those institutional contracts
View full franchise scores
Baseline70.00
Advantages+1.52 pts
Constraints-0.18 pts
Net local movement+1.340 pts
Final score71.34

3 advantages and 1 constraint used to calculate the score for FASTSIGNS. 2 additional scored adjustments are below the display threshold and contribute +0.081 points to the total.

Largest individual local score driverMilitary installation scale+0.67 pts
Overall local score movement+1.340 ptsThis is the total after all factors are accounted for.

Franchise evidence

Source material assessed

Litigation
1 image
Other fees (item 6)
1 image
Estimated initial investment
2 images
Territory rights
1 image
Item 19 β€” Financial Performance Representation
2 images
Evidence confidence

Audit layer

Full franchise calculation

Evidence confidence

City Modifier Evidence
Strong
Factor Research Coverage
Adequate
Franchise-profile completeness
Strong
Source-evidence confidence
Strong
Geographic applicability
Strong
Overall evidence confidence
Moderate evidence confidence
Largest absolute effect
Customer demand +1.52 pts
Tested rank range
#1–#12
#271.14

PuroClean

Initial investment: $54,575–$262,145

Advantage +0.51 pts Military installation scaleConstraint -0.27 pts Installation, maintenance and repair mean hourly wage

Rank sensitivity: Stable (#2–#2 in distinct rank tests; 1 display-tied test separately)

Candidate-specific considerations (7)

Not included in this score

Potential candidate advantage

Mapped flood or coastal flood exposure

Repair and replacement demand
Evidence confidence: HighSource [28]FEMA Special Flood Hazard Areas in San Diego
Operating relationshipMapped flood or coastal flood exposure
Applicability depends on the selected floodplain
Potential candidate advantage

Wildfire and defensible-space exposure

Repair and replacement demand
Evidence confidence: HighSource [27]City of San Diego Very High Fire Hazard Severity Zones
Operating relationshipWildfire and defensible-space exposure
Applicability depends on the selected wildfire zone
Potential candidate constraint

Pure Water San Diego Phase 1 β€” Corridor or highway construction disruption

Driving, routing, and parking
Evidence confidence: HighSource [38]Eastgate Mall / Miramar Pure Water construction corridor
Operating relationshipShort-term driving and routing disruption
Applicability depends on the selected corridor
Potential candidate constraint

Commercial-vehicle route or access restrictions

Driving, routing, and parking
Evidence confidence: HighSource [31]San Diego communities south of downtown
Operating relationshipCommercial-vehicle route or access restrictions
Applicability depends on the selected district
Potential candidate constraint

Institutional procurement and vendor-onboarding friction

Referral channels
Evidence confidence: HighSource [35] [36]San Diego institutional procurement environment
Operating relationshipInstitutional procurement and vendor-onboarding friction
City and port bidder enrollment only apply when pursuing those institutional contracts
Potential candidate advantage

PHCC San Diego β€” Contractor and trade referral channels

Referral channels
Evidence confidence: ModerateSource [49]PHCC San Diego trade network
Operating relationshipContractor and trade referral channels
Applicability depends on the selected submarket
Potential candidate constraint

Commercial-vehicle storage restrictions

Local rules and operating requirements
Evidence confidence: HighSource [32]Residential areas of San Diego
Operating relationshipCommercial-vehicle storage restrictions
Applicability depends on the selected neighborhood
View full franchise scores
Baseline70.00
Advantages+1.66 pts
Constraints-0.52 pts
Net local movement+1.141 pts
Final score71.14

4 advantages and 2 constraints used to calculate the score for PuroClean. 2 additional scored adjustments are below the display threshold and contribute +0.055 points to the total.

Largest individual local score driverMilitary installation scale+0.51 pts
Overall local score movement+1.141 ptsThis is the total after all factors are accounted for.

Franchise evidence

FDD screenshots

Litigation
1 image
Other fees (item 6)
1 image
Estimated initial investment
2 images
Territory rights
1 image
Evidence confidence

Audit layer

Full franchise calculation

Evidence confidence

City Modifier Evidence
Strong
Factor Research Coverage
Adequate
Franchise-profile completeness
Strong
Source-evidence confidence
Strong
Geographic applicability
Strong
Overall evidence confidence
High evidence confidence
Largest absolute effect
Customer demand +1.29 pts
Tested rank range
#2–#2
#370.85

City Wide Facility Solutions

Initial investment: $229,729–$410,730

Advantage +0.71 pts Military installation scaleConstraint -0.10 pts Construction and extraction mean hourly wage

Rank sensitivity: Stable (#3–#3 in distinct rank tests; 1 display-tied test separately)

Candidate-specific considerations (1)

Not included in this score

Potential candidate constraint

Institutional procurement and vendor-onboarding friction

Referral channels
Evidence confidence: HighSource [35] [36]San Diego institutional procurement environment
Operating relationshipInstitutional procurement and vendor-onboarding friction
City and port bidder enrollment only apply when pursuing those institutional contracts
View full franchise scores
Baseline70.00
Advantages+0.95 pts
Constraints-0.10 pts
Net local movement+0.850 pts
Final score70.85

3 advantages and 1 constraint used to calculate the score for City Wide Facility Solutions. 2 additional scored adjustments are below the display threshold and contribute +0.058 points to the total.

Largest individual local score driverMilitary installation scale+0.71 pts
Overall local score movement+0.850 ptsThis is the total after all factors are accounted for.

Franchise evidence

FDD screenshots

Litigation
1 image
Other fees (item 6)
1 image
Estimated initial investment
2 images
Territory rights
1 image
Evidence confidence

Audit layer

Full franchise calculation

Evidence confidence

City Modifier Evidence
Strong
Factor Research Coverage
Adequate
Franchise-profile completeness
Strong
Source-evidence confidence
Strong
Geographic applicability
Strong
Overall evidence confidence
Moderate evidence confidence
Largest absolute effect
Customer demand +0.95 pts
Tested rank range
#3–#3
#470.54

Rainbow International Restoration

Initial investment: $185,336–$351,900

Advantage +0.47 pts Military installation scaleConstraint -0.49 pts Owner-occupied housing share

Rank sensitivity: Stable (#4–#4 in distinct rank tests; 1 display-tied test separately)

Candidate-specific considerations (6)

Not included in this score

Potential candidate advantage

Mapped flood or coastal flood exposure

Repair and replacement demand
Evidence confidence: HighSource [28]FEMA Special Flood Hazard Areas in San Diego
Operating relationshipMapped flood or coastal flood exposure
Applicability depends on the selected floodplain
Potential candidate advantage

Wildfire and defensible-space exposure

Repair and replacement demand
Evidence confidence: HighSource [27]City of San Diego Very High Fire Hazard Severity Zones
Operating relationshipWildfire and defensible-space exposure
Applicability depends on the selected wildfire zone
Potential candidate constraint

Pure Water San Diego Phase 1 β€” Corridor or highway construction disruption

Driving, routing, and parking
Evidence confidence: HighSource [38]Eastgate Mall / Miramar Pure Water construction corridor
Operating relationshipShort-term driving and routing disruption
Applicability depends on the selected corridor
Potential candidate constraint

Commercial-vehicle route or access restrictions

Driving, routing, and parking
Evidence confidence: HighSource [31]San Diego communities south of downtown
Operating relationshipCommercial-vehicle route or access restrictions
Applicability depends on the selected district
Potential candidate constraint

Institutional procurement and vendor-onboarding friction

Referral channels
Evidence confidence: HighSource [35] [36]San Diego institutional procurement environment
Operating relationshipInstitutional procurement and vendor-onboarding friction
City and port bidder enrollment only apply when pursuing those institutional contracts
Potential candidate advantage

PHCC San Diego β€” Contractor and trade referral channels

Referral channels
Evidence confidence: ModerateSource [49]PHCC San Diego trade network
Operating relationshipContractor and trade referral channels
Applicability depends on the selected submarket
View full franchise scores
Baseline70.00
Advantages+1.30 pts
Constraints-0.76 pts
Net local movement+0.542 pts
Final score70.54

4 advantages and 2 constraints used to calculate the score for Rainbow International Restoration. 2 additional scored adjustments are below the display threshold and contribute +0.054 points to the total.

Largest individual local score driverOwner-occupied housing share-0.49 pts
Overall local score movement+0.542 ptsThis is the total after all factors are accounted for.

Franchise evidence

FDD screenshots

Litigation
1 image
Other fees (item 6)
1 image
Estimated initial investment
2 images
Territory rights
1 image
Evidence confidence

Audit layer

Full franchise calculation

Evidence confidence

City Modifier Evidence
Strong
Factor Research Coverage
Adequate
Franchise-profile completeness
Strong
Source-evidence confidence
Strong
Geographic applicability
Strong
Overall evidence confidence
High evidence confidence
Largest absolute effect
Customer demand +0.69 pts
Tested rank range
#4–#4
#570.30

Aire Serv

Initial investment: $113,308–$271,708

Advantage +0.43 pts Median owner-occupied home valueConstraint -0.73 pts Owner-occupied housing share

Rank sensitivity: Highly sensitive (#2–#8 in distinct rank tests)

Candidate-specific considerations (2)

Not included in this score

Potential candidate constraint

Commercial-vehicle route or access restrictions

Driving, routing, and parking
Evidence confidence: HighSource [31]San Diego communities south of downtown
Operating relationshipCommercial-vehicle route or access restrictions
Applicability depends on the selected district
Potential candidate constraint

Commercial-vehicle storage restrictions

Local rules and operating requirements
Evidence confidence: HighSource [32]Residential areas of San Diego
Operating relationshipCommercial-vehicle storage restrictions
Applicability depends on the selected neighborhood
View full franchise scores
Baseline70.00
Advantages+1.52 pts
Constraints-1.23 pts
Net local movement+0.296 pts
Final score70.30

6 advantages and 3 constraints used to calculate the score for Aire Serv. 2 additional scored adjustments are below the display threshold and contribute +0.042 points to the total.

Largest individual local score driverOwner-occupied housing share-0.73 pts
Overall local score movement+0.296 ptsThis is the total after all factors are accounted for.

Franchise evidence

Source material assessed

Litigation
1 image
Other fees (item 6)
1 image
Estimated initial investment
1 image
Territory rights
1 image
Item 19 β€” Financial Performance Representation
1 image
Brand material assessed
1 source
Evidence confidence

Audit layer

Full franchise calculation

Evidence confidence

City Modifier Evidence
Strong
Factor Research Coverage
Adequate
Franchise-profile completeness
Strong
Source-evidence confidence
Strong
Geographic applicability
Strong
Overall evidence confidence
Moderate evidence confidence
Largest absolute effect
Hiring and staffing conditions -0.41 pts
Tested rank range
#2–#8
#670.29

ZOOM DRAIN

Initial investment: $266,250–$570,500

Advantage +0.37 pts Median owner-occupied home valueConstraint -0.72 pts Owner-occupied housing share

Rank sensitivity: Stable (#5–#6 in distinct rank tests; 1 display-tied test separately)

Candidate-specific considerations (3)

Not included in this score

Potential candidate constraint

Pure Water San Diego Phase 1 β€” Corridor or highway construction disruption

Driving, routing, and parking
Evidence confidence: HighSource [38]Eastgate Mall / Miramar Pure Water construction corridor
Operating relationshipShort-term driving and routing disruption
Applicability depends on the selected corridor
Potential candidate constraint

Commercial-vehicle route or access restrictions

Driving, routing, and parking
Evidence confidence: HighSource [31]San Diego communities south of downtown
Operating relationshipCommercial-vehicle route or access restrictions
Applicability depends on the selected district
Potential candidate advantage

PHCC San Diego β€” Contractor and trade referral channels

Referral channels
Evidence confidence: ModerateSource [49]PHCC San Diego trade network
Operating relationshipContractor and trade referral channels
Applicability depends on the selected submarket
View full franchise scores
Baseline70.00
Advantages+1.50 pts
Constraints-1.21 pts
Net local movement+0.287 pts
Final score70.29

7 advantages and 3 constraints used to calculate the score for ZOOM DRAIN. 4 additional scored adjustments are below the display threshold and contribute +0.074 points to the total.

Largest individual local score driverOwner-occupied housing share-0.72 pts
Overall local score movement+0.287 ptsThis is the total after all factors are accounted for.

Franchise evidence

FDD screenshots

Litigation
1 image
Other fees (item 6)
1 image
Estimated initial investment
2 images
Territory rights
1 image
Evidence confidence

Audit layer

Full franchise calculation

Evidence confidence

City Modifier Evidence
Strong
Factor Research Coverage
Adequate
Franchise-profile completeness
Strong
Source-evidence confidence
Strong
Geographic applicability
Strong
Overall evidence confidence
Moderate evidence confidence
Largest absolute effect
Customer demand +0.52 pts
Tested rank range
#5–#6
#770.10

ActionCOACH

Initial investment: $71,668–$303,513

Advantage +0.20 pts Military installation scaleNo material negative local adjustment identified

Rank sensitivity: Moderately sensitive (#6–#9 in distinct rank tests; 1 display-tied test separately)

View full franchise scores
Baseline70.00
Advantages+0.20 pts
Local constraints0.00 pts
Model adjustments-0.10 pts
Net score movement+0.096 pts
Final score70.10

1 advantage and 0 local constraints, plus 1 model adjustment, used to calculate the score for ActionCOACH.

Largest individual local score driverMilitary installation scale+0.20 pts
Overall score movement+0.096 ptsThis is the total after all score components are accounted for.

Franchise evidence

FDD screenshots

Litigation
1 image
Other fees (item 6)
1 image
Estimated initial investment
2 images
Territory rights
1 image
Evidence confidence

Audit layer

Full franchise calculation

Evidence confidence

City Modifier Evidence
Strong
Factor Research Coverage
Adequate
Franchise-profile completeness
Strong
Source-evidence confidence
Strong
Geographic applicability
Strong
Overall evidence confidence
Moderate evidence confidence
Largest absolute effect
Customer demand +0.20 pts
Tested rank range
#6–#9
#870.09

Pillar To Post Home Inspectors

Initial investment: $102,690–$134,290

Advantage +0.70 pts Housing units permittedConstraint -0.73 pts Owner-occupied housing share

Rank sensitivity: Stable (#7–#8 in distinct rank tests; 1 display-tied test separately)

View full franchise scores
Baseline70.00
Advantages+1.10 pts
Constraints-1.02 pts
Net local movement+0.085 pts
Final score70.09

4 advantages and 2 constraints used to calculate the score for Pillar To Post Home Inspectors.

Largest individual local score driverOwner-occupied housing share-0.73 pts
Overall local score movement+0.085 ptsThis is the total after all factors are accounted for.

Franchise evidence

Source material assessed

Litigation
1 image
Other fees (item 6)
1 image
Estimated initial investment
2 images
Territory rights
1 image
Item 19 β€” Financial Performance Representation
1 image
Brand material assessed
2 sources
Evidence confidence

Audit layer

Full franchise calculation

Evidence confidence

City Modifier Evidence
Strong
Factor Research Coverage
Adequate
Franchise-profile completeness
Strong
Source-evidence confidence
Strong
Geographic applicability
Strong
Overall evidence confidence
Moderate evidence confidence
Largest absolute effect
Hiring and staffing conditions -0.29 pts
Tested rank range
#7–#8
#970.03

Mr. Rooter

Initial investment: $152,900–$298,675

Advantage +0.37 pts Median owner-occupied home valueConstraint -0.72 pts Owner-occupied housing share

Rank sensitivity: Moderately sensitive (#7–#9 in distinct rank tests; 1 display-tied test separately)

Candidate-specific considerations (3)

Not included in this score

Potential candidate constraint

Pure Water San Diego Phase 1 β€” Corridor or highway construction disruption

Driving, routing, and parking
Evidence confidence: HighSource [38]Eastgate Mall / Miramar Pure Water construction corridor
Operating relationshipShort-term driving and routing disruption
Applicability depends on the selected corridor
Potential candidate constraint

Commercial-vehicle route or access restrictions

Driving, routing, and parking
Evidence confidence: HighSource [31]San Diego communities south of downtown
Operating relationshipCommercial-vehicle route or access restrictions
Applicability depends on the selected district
Potential candidate constraint

Commercial-vehicle storage restrictions

Local rules and operating requirements
Evidence confidence: HighSource [32]Residential areas of San Diego
Operating relationshipCommercial-vehicle storage restrictions
Applicability depends on the selected neighborhood
View full franchise scores
Baseline70.00
Advantages+1.33 pts
Constraints-1.30 pts
Net local movement+0.028 pts
Final score70.03

5 advantages and 3 constraints used to calculate the score for Mr. Rooter. 1 additional scored adjustment is below the display threshold and contributes +0.016 points to the total.

Largest individual local score driverOwner-occupied housing share-0.72 pts
Overall local score movement+0.028 ptsThis is the total after all factors are accounted for.

Franchise evidence

FDD screenshots

Litigation
1 image
Other fees (item 6)
1 image
Estimated initial investment
2 images
Territory rights
1 image
Evidence confidence

Audit layer

Full franchise calculation

Evidence confidence

City Modifier Evidence
Strong
Factor Research Coverage
Adequate
Franchise-profile completeness
Strong
Source-evidence confidence
Strong
Geographic applicability
Strong
Overall evidence confidence
Moderate evidence confidence
Largest absolute effect
Hiring and staffing conditions -0.40 pts
Tested rank range
#7–#9
#1069.86

Tiger Adjusters

Initial investment: $43,050–$159,500

Advantage +0.40 pts Median owner-occupied home valueConstraint -0.65 pts Owner-occupied housing share

Rank sensitivity: Stable (#10–#11 in distinct rank tests; 1 display-tied test separately)

Candidate-specific considerations (1)

Not included in this score

Potential candidate advantage

PHCC San Diego β€” Contractor and trade referral channels

Referral channels
Evidence confidence: ModerateSource [49]PHCC San Diego trade network
Operating relationshipContractor and trade referral channels
Applicability depends on the selected submarket
View full franchise scores
Baseline70.00
Advantages+0.66 pts
Constraints-0.79 pts
Net local movement-0.138 pts
Final score69.86

3 advantages and 2 constraints used to calculate the score for Tiger Adjusters. 1 additional scored adjustment is below the display threshold and contributes +0.027 points to the total.

Largest individual local score driverOwner-occupied housing share-0.65 pts
Overall local score movement-0.138 ptsThis is the total after all factors are accounted for.

Franchise evidence

Source material assessed

Litigation
1 image
Other fees (item 6)
1 image
Estimated initial investment
2 images
Territory rights
1 image
Item 19 β€” Financial Performance Representation
1 image
Brand material assessed
1 source
Evidence confidence

Audit layer

Full franchise calculation

Evidence confidence

City Modifier Evidence
Strong
Factor Research Coverage
Adequate
Franchise-profile completeness
Strong
Source-evidence confidence
Strong
Geographic applicability
Strong
Overall evidence confidence
Moderate evidence confidence
Largest absolute effect
Hiring and staffing conditions -0.15 pts
Tested rank range
#10–#11
#1169.76

HomeSmiles

Initial investment: $148,110–$201,800

Advantage +0.35 pts Military installation scaleConstraint -0.80 pts Owner-occupied housing share

Rank sensitivity: Moderately sensitive (#10–#12 in distinct rank tests; 1 display-tied test separately)

Candidate-specific considerations (1)

Not included in this score

Potential candidate constraint

Commercial-vehicle route or access restrictions

Driving, routing, and parking
Evidence confidence: HighSource [31]San Diego communities south of downtown
Operating relationshipCommercial-vehicle route or access restrictions
Applicability depends on the selected district
View full franchise scores
Baseline70.00
Advantages+1.00 pts
Constraints-1.24 pts
Net local movement-0.237 pts
Final score69.76

4 advantages and 3 constraints used to calculate the score for HomeSmiles. 2 additional scored adjustments are below the display threshold and contribute +0.079 points to the total.

Largest individual local score driverOwner-occupied housing share-0.80 pts
Overall local score movement-0.237 ptsThis is the total after all factors are accounted for.

Franchise evidence

FDD screenshots

Litigation
1 image
Other fees (item 6)
1 image
Estimated initial investment
2 images
Territory rights
1 image
Evidence confidence

Audit layer

Full franchise calculation

Evidence confidence

City Modifier Evidence
Strong
Factor Research Coverage
Adequate
Franchise-profile completeness
Strong
Source-evidence confidence
Strong
Geographic applicability
Strong
Overall evidence confidence
Moderate evidence confidence
Largest absolute effect
Customer demand -0.21 pts
Tested rank range
#10–#12
#1269.69

Mister Sparky Electric

Advantage +0.31 pts Median owner-occupied home valueConstraint -0.89 pts Owner-occupied housing share

Rank sensitivity: Highly sensitive (#1–#12 in distinct rank tests)

Candidate-specific considerations (1)

Not included in this score

Potential candidate constraint

Pure Water San Diego Phase 1 β€” Corridor or highway construction disruption

Driving, routing, and parking
Evidence confidence: HighSource [38]Eastgate Mall / Miramar Pure Water construction corridor
Operating relationshipShort-term driving and routing disruption
Applicability depends on the selected corridor
View full franchise scores
Baseline70.00
Advantages+1.07 pts
Constraints-1.38 pts
Net local movement-0.314 pts
Final score69.69

5 advantages and 3 constraints used to calculate the score for Mister Sparky Electric. 1 additional scored adjustment is below the display threshold and contributes +0.010 points to the total.

Largest individual local score driverOwner-occupied housing share-0.89 pts
Overall local score movement-0.314 ptsThis is the total after all factors are accounted for.
Evidence confidence

Audit layer

Full franchise calculation

Evidence confidence

City Modifier Evidence
Strong
Factor Research Coverage
Adequate
Franchise-profile completeness
Strong
Source-evidence confidence
Strong
Geographic applicability
Strong
Overall evidence confidence
High evidence confidence
Largest absolute effect
Repair and replacement demand +0.36 pts
Tested rank range
#1–#12
#1367.73

Workout Anytime

Initial investment: $1,060,850–$1,840,550

Advantage +0.10 pts Healthcare support employment shareConstraint -1.28 pts SDG&E small-commercial average electric rate

Rank sensitivity: Stable (#13–#13 in distinct rank tests)

Candidate-specific considerations (6)

Not included in this score

Potential candidate constraint

Mapped flood or coastal flood exposure

Repair and replacement demand
Evidence confidence: HighSource [28]FEMA Special Flood Hazard Areas in San Diego
Operating relationshipMapped flood or coastal flood exposure
Applicability depends on the selected floodplain
Potential candidate constraint

Wildfire and defensible-space exposure

Repair and replacement demand
Evidence confidence: HighSource [27]City of San Diego Very High Fire Hazard Severity Zones
Operating relationshipWildfire and defensible-space exposure
Applicability depends on the selected wildfire zone
Potential candidate constraint

Transportation/development impact fees

Local rules and operating requirements
Evidence confidence: HighSource [47] [48]City of San Diego development-impact-fee framework
Operating relationshipTransportation/development impact fees
Development impact fees require a qualifying construction, expansion or permitted project
Potential candidate constraint

San Diego Building Energy Benchmarking Ordinance β€” Building-efficiency compliance

Local rules and operating requirements
Evidence confidence: HighSource [44]City of San Diego covered buildings
Operating relationshipCost of meeting building requirements
Benchmarking compliance costs depend on a covered facility and the selected owner/tenant obligations
Potential candidate constraint

Historic-district or design-review requirements

Local rules and operating requirements
Evidence confidence: HighSource [41] [39]Designated historic districts and historic-resource sites
Operating relationshipHistoric-district or design-review requirements
Historic design review applies only at a designated site with qualifying exterior changes
Potential candidate constraint

City of San Diego Floodplain Management program β€” development and elevation requirements

Local rules and operating requirements
Evidence confidence: HighSource [46] [45]FEMA Special Flood Hazard Areas in San Diego
Operating relationshipFloodplain development and elevation requirements
Flood-hazard building requirements require a qualifying parcel and project
View full franchise scores
Baseline70.00
Advantages+0.16 pts
Constraints-2.43 pts
Net local movement-2.270 pts
Final score67.73

2 advantages and 4 constraints used to calculate the score for Workout Anytime.

Largest individual local score driverSDG&E small-commercial average electric rate-1.28 pts
Overall local score movement-2.270 ptsThis is the total after all factors are accounted for.

Franchise evidence

FDD screenshots

Litigation
1 image
Other fees (item 6)
1 image
Estimated initial investment
2 images
Territory rights
1 image
Evidence confidence

Audit layer

Full franchise calculation

Evidence confidence

City Modifier Evidence
Strong
Factor Research Coverage
Adequate
Franchise-profile completeness
Strong
Source-evidence confidence
Strong
Geographic applicability
Strong
Overall evidence confidence
Moderate evidence confidence
Largest absolute effect
Local rules and operating requirements -1.54 pts
Tested rank range
#13–#13

Factor categories with the highest impact

Which local conditions had the biggest impact?

We removed one factor category at a time, recalculated everything, and measured movements.

Observed model effectMixed or model dependent

Customer demand

We tested how much of the city’s potential customer and business demand remained after accounting for operating challenges.

Why concepts react differently

We modeled a measurable customer demand impact on 12 of the 13 franchises in San Diego. Removing the entire customer demand category changed the ranks of 9 franchises. FASTSIGNS moved from #1 to #12, tied for the largest rank change among franchises directly affected by this category.

Concepts adjusted12 of 13
Average among affected+0.38 pts
Average across all concepts+0.36 pts
Concepts changing rank9

What we observed

  • Population Change Since 20201.6%
  • Owner Occupied Housing Share47.3%
  • Housing Units Permitted8,782 housing units

Concepts helped most

FASTSIGNSSigns & Graphics
+1.52 pts
PuroCleanProperty Restoration
+1.29 pts
City Wide Facility SolutionsIntegrated Facility Management
+0.95 pts
Rainbow International RestorationProperty Restoration
+0.69 pts
ZOOM DRAINPlumbing & Drain Services
+0.52 pts

Concepts challenged most

Workout AnytimeFull-Service Fitness
-0.83 pts
Mister Sparky ElectricElectrical Services
-0.33 pts
HomeSmilesRecurring Property Maintenance
-0.21 pts
Factors without a displayed score adjustment
  • Local competitionNot included in the score
  • Driving, routing, and parkingCandidate-dependent; not included in the score
  • Finding and operating the right locationNot included in the score
  • Winning new customersNot included in the score
  • Referral channelsCandidate-dependent; not included in the score
  • Territory conditionsNot included in the score

Rank stability

Which positions depend most on individual assumptions?

Removing customer demand moved FASTSIGNS from #1 to #12.

Rankings across factor-removal tests
The leader’s margin in each test
Score changes when factors are removed
The ranking with one factor removed
The local relationships behind that test
All test results

10 complete tests; 6 changed no scores; 4 active tests

FranchiseCurrent rankAvg active distinct-test rankBest distinct rankWorst distinct rankTest at furthest distinct rank
FASTSIGNS#13.75#1#12Customer demand
PuroClean#22.00#2#2 (1 display-tied test omitted from distinct rank endpoints)No distinct rank deterioration
City Wide Facility Solutions#33.00#3#3 (1 display-tied test omitted from distinct rank endpoints)No distinct rank deterioration
Rainbow International Restoration#44.00#4#4 (1 display-tied test omitted from distinct rank endpoints)No distinct rank deterioration
Aire Serv#55.00#2#8Repair and replacement demand
ZOOM DRAIN#65.67#5#6 (1 display-tied test omitted from distinct rank endpoints)No distinct rank deterioration
ActionCOACH#77.33#6#9 (1 display-tied test omitted from distinct rank endpoints)Hiring and staffing conditions
Pillar To Post Home Inspectors#87.67#7#8 (1 display-tied test omitted from distinct rank endpoints)No distinct rank deterioration
Mr. Rooter#98.33#7#9 (1 display-tied test omitted from distinct rank endpoints)No distinct rank deterioration
Tiger Adjusters#1010.67#10#11 (1 display-tied test omitted from distinct rank endpoints)Hiring and staffing conditions; Local rules and operating requirements
HomeSmiles#1111.00#10#12 (1 display-tied test omitted from distinct rank endpoints)Hiring and staffing conditions
Mister Sparky Electric#128.75#1#12No distinct rank deterioration
Workout Anytime#1313.00#13#13No distinct rank deterioration

Rank ranges and sensitivity labels use only distinct displayed positions; tests ending in displayed ties are reported separately. Average active-test rank excludes factor removals that changed no score and tests that ended in display ties. Factor-removal scenarios test assumptions; they are not probabilities or confidence intervals.

Customer demand removed
FranchiseCurrent rankRank after removalCurrent scoreScore after removalScore change
Mister Sparky Electric#12#169.68623270.153910+0.467678
Aire Serv#5#270.29554470.133759-0.161785
HomeSmiles#11#3–#5 (display tie)69.76310069.973222+0.210122
Rainbow International Restoration#4#3–#5 (display tie)70.54223969.971968-0.570271
PuroClean#2#3–#5 (display tie)71.14054669.971897-1.168649
ZOOM DRAIN#6#6–#7 (display tie)70.28677169.927484-0.359287
Mr. Rooter#9#6–#7 (display tie)70.02764869.926791-0.100857
ActionCOACH#7#8–#9 (display tie)70.09635069.900000-0.196350
City Wide Facility Solutions#3#8–#9 (display tie)70.84994769.899292-0.950655
Pillar To Post Home Inspectors#8#10–#11 (display tie)70.08529069.853206-0.232084
Tiger Adjusters#10#10–#11 (display tie)69.86157469.850674-0.010900
FASTSIGNS#1#1271.33954269.820114-1.519428
Workout Anytime#13#1367.73019468.563297+0.833103
Repair and replacement demand removed
FranchiseCurrent rankRank after removalCurrent scoreScore after removalScore change
FASTSIGNS#1#171.33954271.3395420.000000
PuroClean#2#271.14054671.017423-0.123123
City Wide Facility Solutions#3#370.84994770.8499470.000000
Rainbow International Restoration#4#470.54223970.419429-0.122810
ZOOM DRAIN#6#570.28677170.139828-0.146943
ActionCOACH#7#670.09635070.0963500.000000
Pillar To Post Home Inspectors#8#770.08529070.008739-0.076551
Aire Serv#5#870.29554469.917520-0.378024
Mr. Rooter#9#970.02764869.880706-0.146942
Tiger Adjusters#10#1069.86157469.8615740.000000
HomeSmiles#11#1169.76310069.7631000.000000
Mister Sparky Electric#12#1269.68623269.337158-0.349074
Workout Anytime#13#1367.73019467.7301940.000000
Local competition removed
FranchiseCurrent rankRank after removalCurrent scoreScore after removalScore change
FASTSIGNS#1#171.33954271.3395420.000000
PuroClean#2#271.14054671.1405460.000000
City Wide Facility Solutions#3#370.84994770.8499470.000000
Rainbow International Restoration#4#470.54223970.5422390.000000
Aire Serv#5#570.29554470.2955440.000000
ZOOM DRAIN#6#670.28677170.2867710.000000
ActionCOACH#7#770.09635070.0963500.000000
Pillar To Post Home Inspectors#8#870.08529070.0852900.000000
Mr. Rooter#9#970.02764870.0276480.000000
Tiger Adjusters#10#1069.86157469.8615740.000000
HomeSmiles#11#1169.76310069.7631000.000000
Mister Sparky Electric#12#1269.68623269.6862320.000000
Workout Anytime#13#1367.73019467.7301940.000000
Hiring and staffing conditions removed
FranchiseCurrent rankRank after removalCurrent scoreScore after removalScore change
FASTSIGNS#1#171.33954271.419428+0.079886
PuroClean#2#271.14054671.414896+0.274350
City Wide Facility Solutions#3#370.84994770.850655+0.000708
Rainbow International Restoration#4#470.54223970.815891+0.273652
Aire Serv#5#570.29554470.706017+0.410473
ZOOM DRAIN#6#670.28677170.685109+0.398338
Mr. Rooter#9#770.02764870.426680+0.399032
Pillar To Post Home Inspectors#8#870.08529070.379081+0.293791
ActionCOACH#7#970.09635070.0963500.000000
Mister Sparky Electric#12#1069.68623270.030212+0.343980
Tiger Adjusters#10#1169.86157470.010900+0.149326
HomeSmiles#11#1269.76310069.660140-0.102960
Workout Anytime#13#1367.73019467.626970-0.103224
Driving, routing, and parking removed
FranchiseCurrent rankRank after removalCurrent scoreScore after removalScore change
FASTSIGNS#1#171.33954271.3395420.000000
PuroClean#2#271.14054671.1405460.000000
City Wide Facility Solutions#3#370.84994770.8499470.000000
Rainbow International Restoration#4#470.54223970.5422390.000000
Aire Serv#5#570.29554470.2955440.000000
ZOOM DRAIN#6#670.28677170.2867710.000000
ActionCOACH#7#770.09635070.0963500.000000
Pillar To Post Home Inspectors#8#870.08529070.0852900.000000
Mr. Rooter#9#970.02764870.0276480.000000
Tiger Adjusters#10#1069.86157469.8615740.000000
HomeSmiles#11#1169.76310069.7631000.000000
Mister Sparky Electric#12#1269.68623269.6862320.000000
Workout Anytime#13#1367.73019467.7301940.000000
Finding and operating the right location removed
FranchiseCurrent rankRank after removalCurrent scoreScore after removalScore change
FASTSIGNS#1#171.33954271.3395420.000000
PuroClean#2#271.14054671.1405460.000000
City Wide Facility Solutions#3#370.84994770.8499470.000000
Rainbow International Restoration#4#470.54223970.5422390.000000
Aire Serv#5#570.29554470.2955440.000000
ZOOM DRAIN#6#670.28677170.2867710.000000
ActionCOACH#7#770.09635070.0963500.000000
Pillar To Post Home Inspectors#8#870.08529070.0852900.000000
Mr. Rooter#9#970.02764870.0276480.000000
Tiger Adjusters#10#1069.86157469.8615740.000000
HomeSmiles#11#1169.76310069.7631000.000000
Mister Sparky Electric#12#1269.68623269.6862320.000000
Workout Anytime#13#1367.73019467.7301940.000000
Winning new customers removed
FranchiseCurrent rankRank after removalCurrent scoreScore after removalScore change
FASTSIGNS#1#171.33954271.3395420.000000
PuroClean#2#271.14054671.1405460.000000
City Wide Facility Solutions#3#370.84994770.8499470.000000
Rainbow International Restoration#4#470.54223970.5422390.000000
Aire Serv#5#570.29554470.2955440.000000
ZOOM DRAIN#6#670.28677170.2867710.000000
ActionCOACH#7#770.09635070.0963500.000000
Pillar To Post Home Inspectors#8#870.08529070.0852900.000000
Mr. Rooter#9#970.02764870.0276480.000000
Tiger Adjusters#10#1069.86157469.8615740.000000
HomeSmiles#11#1169.76310069.7631000.000000
Mister Sparky Electric#12#1269.68623269.6862320.000000
Workout Anytime#13#1367.73019467.7301940.000000
Referral channels removed
FranchiseCurrent rankRank after removalCurrent scoreScore after removalScore change
FASTSIGNS#1#171.33954271.3395420.000000
PuroClean#2#271.14054671.1405460.000000
City Wide Facility Solutions#3#370.84994770.8499470.000000
Rainbow International Restoration#4#470.54223970.5422390.000000
Aire Serv#5#570.29554470.2955440.000000
ZOOM DRAIN#6#670.28677170.2867710.000000
ActionCOACH#7#770.09635070.0963500.000000
Pillar To Post Home Inspectors#8#870.08529070.0852900.000000
Mr. Rooter#9#970.02764870.0276480.000000
Tiger Adjusters#10#1069.86157469.8615740.000000
HomeSmiles#11#1169.76310069.7631000.000000
Mister Sparky Electric#12#1269.68623269.6862320.000000
Workout Anytime#13#1367.73019467.7301940.000000
Territory conditions removed
FranchiseCurrent rankRank after removalCurrent scoreScore after removalScore change
FASTSIGNS#1#171.33954271.3395420.000000
PuroClean#2#271.14054671.1405460.000000
City Wide Facility Solutions#3#370.84994770.8499470.000000
Rainbow International Restoration#4#470.54223970.5422390.000000
Aire Serv#5#570.29554470.2955440.000000
ZOOM DRAIN#6#670.28677170.2867710.000000
ActionCOACH#7#770.09635070.0963500.000000
Pillar To Post Home Inspectors#8#870.08529070.0852900.000000
Mr. Rooter#9#970.02764870.0276480.000000
Tiger Adjusters#10#1069.86157469.8615740.000000
HomeSmiles#11#1169.76310069.7631000.000000
Mister Sparky Electric#12#1269.68623269.6862320.000000
Workout Anytime#13#1367.73019467.7301940.000000
Local rules and operating requirements removed
FranchiseCurrent rankRank after removalCurrent scoreScore after removalScore change
FASTSIGNS#1#171.33954271.3395420.000000
PuroClean#2#271.14054671.1405460.000000
City Wide Facility Solutions#3#370.84994770.8499470.000000
Rainbow International Restoration#4#470.54223970.5422390.000000
Aire Serv#5#570.29554470.2955440.000000
ZOOM DRAIN#6#670.28677170.2867710.000000
ActionCOACH#7#770.09635070.0963500.000000
Pillar To Post Home Inspectors#8#870.08529070.0852900.000000
Mr. Rooter#9#970.02764870.0276480.000000
HomeSmiles#11#1069.76310069.892838+0.129738
Tiger Adjusters#10#1169.86157469.8615740.000000
Mister Sparky Electric#12#1269.68623269.6862320.000000
Workout Anytime#13#1367.73019469.270121+1.539927
#1 FASTSIGNSHighly sensitive Β· distinct tested #1–#12
#2 PuroCleanStable Β· distinct tested #2–#2 Β· 1 display-tied test excluded
#3 City Wide Facility SolutionsStable Β· distinct tested #3–#3 Β· 1 display-tied test excluded
#4 Rainbow International RestorationStable Β· distinct tested #4–#4 Β· 1 display-tied test excluded
#5 Aire ServHighly sensitive Β· distinct tested #2–#8
#6 ZOOM DRAINStable Β· distinct tested #5–#6 Β· 1 display-tied test excluded
#7 ActionCOACHModerately sensitive Β· distinct tested #6–#9 Β· 1 display-tied test excluded
#8 Pillar To Post Home InspectorsStable Β· distinct tested #7–#8 Β· 1 display-tied test excluded
#9 Mr. RooterModerately sensitive Β· distinct tested #7–#9 Β· 1 display-tied test excluded
#10 Tiger AdjustersStable Β· distinct tested #10–#11 Β· 1 display-tied test excluded
#11 HomeSmilesModerately sensitive Β· distinct tested #10–#12 Β· 1 display-tied test excluded
#12 Mister Sparky ElectricHighly sensitive Β· distinct tested #1–#12
#13 Workout AnytimeStable Β· distinct tested #13–#13

Neutralizing a factor category removes it from every franchise’s calculation. Franchise-specific weighting helps explain differences in its impact.

Net factor impact

Net factor category totals across the listed brands

Within customer demand, positive effects added 1.53 points to PuroClean's score and negative effects subtracted 0.24 points, for a net +1.29 points.

Factor impact among the highest-rated franchise conceptsDiverging dot plot showing nonzero factor score contributions for the top 13 concepts. Zero-point concept-factor pairs are omitted, and factors with no nonzero contributions are excluded.+2.00+1.000.00-1.00-2.00
Customer demand
#1 FASTSIGNS Β· Customer demand Β· +1.52 pts1#2 PuroClean Β· Customer demand Β· +1.29 pts2#3 City Wide Facility Solutions Β· Customer demand Β· +0.95 pts3#4 Rainbow International Restoration Β· Customer demand Β· +0.69 pts4#5 Aire Serv Β· Customer demand Β· +0.31 pts5#6 ZOOM DRAIN Β· Customer demand Β· +0.52 pts6#7 ActionCOACH Β· Customer demand Β· +0.20 pts7#8 Pillar To Post Home Inspectors Β· Customer demand Β· +0.23 pts8#9 Mr. Rooter Β· Customer demand Β· +0.26 pts9#11 HomeSmiles Β· Customer demand Β· -0.21 pts11#12 Mister Sparky Electric Β· Customer demand Β· -0.33 pts12#13 Workout Anytime Β· Customer demand Β· -0.83 pts13
Repair and replacement demand
#2 PuroClean Β· Repair and replacement demand Β· +0.12 pts2#4 Rainbow International Restoration Β· Repair and replacement demand Β· +0.12 pts4#5 Aire Serv Β· Repair and replacement demand Β· +0.40 pts5#6 ZOOM DRAIN Β· Repair and replacement demand Β· +0.16 pts6#8 Pillar To Post Home Inspectors Β· Repair and replacement demand Β· +0.15 pts8#9 Mr. Rooter Β· Repair and replacement demand Β· +0.16 pts9#12 Mister Sparky Electric Β· Repair and replacement demand Β· +0.36 pts12
Hiring and staffing conditions
#1 FASTSIGNS Β· Hiring and staffing conditions Β· -0.18 pts1#2 PuroClean Β· Hiring and staffing conditions Β· -0.27 pts2#3 City Wide Facility Solutions Β· Hiring and staffing conditions Β· -0.10 pts3#4 Rainbow International Restoration Β· Hiring and staffing conditions Β· -0.27 pts4#5 Aire Serv Β· Hiring and staffing conditions Β· -0.41 pts5#6 ZOOM DRAIN Β· Hiring and staffing conditions Β· -0.40 pts6#8 Pillar To Post Home Inspectors Β· Hiring and staffing conditions Β· -0.29 pts8#9 Mr. Rooter Β· Hiring and staffing conditions Β· -0.40 pts9#10 Tiger Adjusters Β· Hiring and staffing conditions Β· -0.15 pts10#11 HomeSmiles Β· Hiring and staffing conditions Β· +0.10 pts11#12 Mister Sparky Electric Β· Hiring and staffing conditions Β· -0.34 pts12#13 Workout Anytime Β· Hiring and staffing conditions Β· +0.10 pts13
Local rules and operating requirements
#7 ActionCOACH Β· Local rules and operating requirements Β· -0.10 pts7#11 HomeSmiles Β· Local rules and operating requirements Β· -0.13 pts11#13 Workout Anytime Β· Local rules and operating requirements Β· -1.54 pts13
Primary source records by factorCustomer demand: [10] [8] [34] [33] [4] [1] [3] [2] [14] [17] [6] [23] [22] [21] [7] [25] [20] [24] [5]Repair and replacement demand: [27] [28] [29] [30] [5] [26]Hiring and staffing conditions: [10] [9] [8] [1] [2]Driving, routing, and parking: [1] [2] [32] [31] [38] [37]Finding and operating the right location: [34] [33] [52]Referral channels: [49] [35] [36] [50] [51]Territory conditions: [1] [31]Local rules and operating requirements: [8] [12] [1] [2] [16] [14] [13] [17] [27] [28] [11] [15] [19] [30] [47] [40] [42] [44] [46] [45] [41] [48] [43] [39] [18]
View the chart data as a table
ConceptCustomer demandRepair and replacement demandHiring and staffing conditionsLocal rules and operating requirements
#1 FASTSIGNS+1.52 ptsβ€”-0.18 ptsβ€”
#2 PuroClean+1.29 pts+0.12 pts-0.27 ptsβ€”
#3 City Wide Facility Solutions+0.95 ptsβ€”-0.10 ptsβ€”
#4 Rainbow International Restoration+0.69 pts+0.12 pts-0.27 ptsβ€”
#5 Aire Serv+0.31 pts+0.40 pts-0.41 ptsβ€”
#6 ZOOM DRAIN+0.52 pts+0.16 pts-0.40 ptsβ€”
#7 ActionCOACH+0.20 ptsβ€”β€”-0.10 pts
#8 Pillar To Post Home Inspectors+0.23 pts+0.15 pts-0.29 ptsβ€”
#9 Mr. Rooter+0.26 pts+0.16 pts-0.40 ptsβ€”
#10 Tiger Adjustersβ€”β€”-0.15 ptsβ€”
#11 HomeSmiles-0.21 ptsβ€”+0.10 pts-0.13 pts
#12 Mister Sparky Electric-0.33 pts+0.36 pts-0.34 ptsβ€”
#13 Workout Anytime-0.83 ptsβ€”+0.10 pts-1.54 pts

Results

How to read the results

As a group, FASTSIGNS, PuroClean, and City Wide Facility Solutions received a larger average modeled benefit from military installation scale through customer demand than the remaining franchises.

Category comparisons

Best franchise categories we assessed in San Diego, California

Summaries require at least 2 concepts in the same category for inclusion.

Limited two-concept comparison

Limited comparison: Property Restoration franchise opportunities assessed in San Diego, California

70.84

2 Property Restoration franchises qualified for comparison, with scores ranging from 70.54 to 71.14. PuroClean ranked highest at 71.14. Customer demand added 0.99 points on average across the included franchises. Hiring and staffing conditions reduced scores across the included franchises by 0.27 points on average.

Interpret diligently: A 0.60-point spread is too small to support an unquestionable brand-level conclusion.

Concepts compared
2
Score range
70.54–71.14
Category average
70.84
PuroClean71.14
Rainbow International Restoration70.54
Limited two-concept comparison

Limited comparison: Plumbing & Drain Services franchise opportunities assessed in San Diego, California

70.16

2 Plumbing & Drain Services franchises qualified for comparison, with scores ranging from 70.03 to 70.29. ZOOM DRAIN ranked highest at 70.29. Customer demand added 0.39 points on average across the included franchises. Hiring and staffing conditions reduced scores across the included franchises by 0.40 points on average.

Interpret diligently: A 0.26-point spread is too small to support an unquestionable brand-level conclusion.

Concepts compared
2
Score range
70.03–70.29
Category average
70.16
ZOOM DRAIN70.29
Mr. Rooter70.03

Metric registry

The 77 metrics behind this study

View all local metrics
MetricRaw valuePeriodGeographyRole in analysisSource
Population estimate1.4 million persons2025San Diego city, CaliforniaContext only [1]
Population change since 20201.6%2020–2025San Diego city, CaliforniaUsed in scoring [1] [2]
Population density4,255.9 people per square mile2020San Diego city, CaliforniaContext only [1]
Household count530,412 households2020–2024San Diego city, CaliforniaContext only [1]
Housing-unit count588,866 housing units2024San Diego city, CaliforniaContext only [4]
Owner-occupied housing share47.3%2020–2024San Diego city, CaliforniaUsed in scoring [1] [2]
Renter-occupied housing share52.4%2019–2023San Diego city, CaliforniaUsed in scoring [5] [2]
Detached single-family housing share43.5%2019–2023San Diego city, CaliforniaUsed in scoring [5] [3]
Housing in buildings with two or more units45.6%2019–2023San Diego city, CaliforniaUsed in scoring [5] [3]
Median year built19782019–2023San Diego city, CaliforniaUsed in scoring [5]
Recent-mover share13.6%2024San Diego city, CaliforniaContext only [4]
Housing units permitted8,782 housing units2024San Diego city, CaliforniaUsed in scoring [6]
Housing units permittedroughly 9,200 housing units2023–2024San Diego city, CaliforniaUsed in scoring [6]
Median owner-occupied home value$906,7002020–2024San Diego city, CaliforniaUsed in scoring [1] [2]
Median household income$108,0772020–2024San Diego city, CaliforniaContext only [1] [2]
Median monthly owner cost with mortgage$3,252 per month2020–2024San Diego city, CaliforniaUsed in scoring [1] [2]
Median gross rent$2,313 per month2020–2024San Diego city, CaliforniaUsed in scoring [1] [2]
Retail sales per capita$18,6332022San Diego city, CaliforniaContext only [1] [2]
Poverty share11%2020–2024San Diego city, CaliforniaContext only [1] [2]
Age 65+ population share14.6%2025 estimate profileSan Diego city, CaliforniaContext only [1] [2]
Under-18 population share18.4%2025 estimate profileSan Diego city, CaliforniaContext only [1] [2]
Under-65 disability share6.8%2020–2024San Diego city, CaliforniaContext only [1] [2]
Under-65 uninsured share6.7%2020–2024San Diego city, CaliforniaSupports modeled relationship [1] [2]
Labor-force participation65.1%2020–2024San Diego city, CaliforniaContext only [1] [2]
Mean travel time to work23.5 minutes2020–2024San Diego city, CaliforniaContext only [1] [2]
Households with broadband subscription95.2%2020–2024San Diego city, CaliforniaContext only [1] [2]
Worked-from-home share19.2%2019–2023San Diego city, CaliforniaSupports modeled relationship [5]
Healthcare and social assistance receipts$22.747 billion2022San Diego city, CaliforniaUsed in scoring [1]
Accommodation and food-service sales$9.965 billion2022San Diego city, CaliforniaContext only [1]
Transportation and warehousing receipts$4.797 billion2022San Diego city, CaliforniaUsed in scoring [1]
Food preparation and serving mean hourly wage$21.26/hourMay 2025San Diego-Chula Vista-Carlsbad MSAUsed in scoring [8]
Mean hourly wage for building and grounds occupations$21.92/hourMay 2025San Diego-Chula Vista-Carlsbad MSAUsed in scoring [8]
Office and administrative support mean hourly wage$27.84/hourMay 2025San Diego-Chula Vista-Carlsbad MSAUsed in scoring [8]
Construction and extraction mean hourly wage$36.54/hourMay 2025San Diego-Chula Vista-Carlsbad MSAUsed in scoring [8]
Installation, maintenance and repair mean hourly wage$33.23/hourMay 2025San Diego-Chula Vista-Carlsbad MSAUsed in scoring [8]
Healthcare practitioner and technical mean hourly wage$65.23/hourMay 2025San Diego-Chula Vista-Carlsbad MSAContext only [8]
Healthcare support employment share5.9%May 2025San Diego-Chula Vista-Carlsbad MSAUsed in scoring [8]
Construction and extraction employment share4.3%May 2025San Diego-Chula Vista-Carlsbad MSAContext only [8]
Installation, maintenance and repair employment share3%May 2025San Diego-Chula Vista-Carlsbad MSAContext only [8]
Unemployment rate4.4%June 2026San Diego-Chula Vista-Carlsbad MSAContext only [9]
Statutory minimum wage$17.75/hour2026San Diego city, CaliforniaUsed in scoring [11] [12]
Business Tax Certificate requirement and base fee$34 base tax + $4 state fee + $1.47 per employee enforcement fee2026San Diego city, CaliforniaContext only [13]
Active business certificate dataset availabilityDaily-updated active business certificate file available2026-08-27San Diego city, CaliforniaContext only [14]
Commercial backflow prevention requirementBackflow assembly required on all 1.5-inch+ multifamily/commercial/industrial meters and all dedicated irrigation metersCurrent 2026City of San Diego Public Utilities water service areaContext only [16]
Food-establishment wastewater discharge permitting requirementAll City food-service establishments require a FEWD permit and appropriate grease-removal equipmentCurrent 2026San Diego city, CaliforniaSupports modeled relationship [17]
Food establishments in FEWD programMore than 5,000 permitted facilitiesCurrent 2026San Diego city, CaliforniaUsed in scoring [17]
Hotel rooms in City of San Diego40,158 hotel rooms2025San Diego city, CaliforniaUsed in scoring [20]
Visitor volume32.4 million visitors2025San Diego-Chula Vista-Carlsbad MSAContext only [20]
San Diego Convention Center primary-convention attendees551,659 attendees2025San Diego Convention CenterSupports modeled relationship [20]
Annual airport passengers25,320,000 passengers2025San Diego International AirportSupports modeled relationship [21]
University of California San Diego enrollment45,273 studentsFall 2024University of California San DiegoContext only [24]
SDSU and Imperial Valley combined enrollment41,184 studentsFall 2025SDSU system reporting scope: San Diego and Imperial ValleyContext only [25]
Mapped 2025 fire hazard severity zonesCity-adopted 2025 map includes Very High Fire Hazard Severity Zones and additional high-risk areasEffective 2025-08-30City of San Diego Fire Hazard Severity ZonesContext only [27]
Ozone nonattainment classificationSevere-15 nonattainment for 2015 8-hour ozone standardCurrent as 2026-07-31San Diego County, CaliforniaSupports modeled relationship [29]
Heavy-duty commercial vehicle residential parking restrictionHeavy-duty commercial vehicles prohibited from residential-area parking except loading/unloading or nearby service callCurrent 2026Residential areas of San DiegoContext only [32]
City bid submission requires vendor registrationRegistration required to submit City bidsCurrentCity of San Diego procurement systemContext only [35]
Port bidding requires PlanetBids vendor registrationAll vendors must register on PlanetBids before bidding or doing work with the PortCurrentPort of San Diego procurement systemContext only [36]
Pure Water Phase 1 active project count12 Phase 1 projects2026Pure Water Phase 1 construction communitiesContext only [37]
Current Pure Water nighttime work on Eastgate MallNighttime pipeline construction notice issued July 10, 20262026-07-10Eastgate Mall / Miramar Pure Water construction corridorContext only [38]
Gaslamp Quarter uses district-specific sign rulesGaslamp Quarter signs are governed by district design guidelines and planned-district rulesCurrentGaslamp QuarterContext only [40]
Sign projects can trigger historic reviewHistoric review may be required for designated resources, designated historic districts, or structures 45 years or olderCurrentDesignated historic districts and historic-resource sitesContext only [39] [41]
Potential historic-resource age screening threshold45 years or olderCurrentPotential historic-resource sitesContext only [39]
Drive-through restaurants are conditional in designated base zonesProcess Three CUP in zones marked CCurrentBase zones where eating/drinking drive-through service is marked CContext only [42]
Drive-through minimum queue spacesMinimum 5 cars per service windowCurrentDrive-through restaurant sites subject to SDMC 141.0607Context only [42]
Drive-through additional pre-order queue length40 additional feet before the order stationCurrentDrive-through restaurant sites subject to SDMC 141.0607Context only [42]
Commercial-building benchmarking size threshold50 thousand square feet2026City of San Diego covered commercial buildingsUsed in scoring [44]
Annual building-energy benchmarking filing deadlineJune 1 annually2026 cycleCity of San Diego covered buildingsUsed in scoring [44]
Elevation Certificate required for new or substantially improved insurable structures in SFHAsElevation Certificate requiredCurrentFEMA Special Flood Hazard Areas in San DiegoContext only [45]
Nonresidential floodproofing alternative requires certificationFloodproofing Certificate required when nonresidential buildings use floodproofing instead of elevationCurrentFEMA Special Flood Hazard Areas in San DiegoContext only [45] [46]
Citywide Development Impact Fees apply to new developmentNew development is assessed citywide DIF for parks, mobility, fire and librariesFY2026/FY2027 current frameworkCity of San DiegoContext only [47] [48]
New nonresidential development can trigger Housing Trust Fund feesHTF applies to new nonresidential development, additions, or qualifying intensification/change of useAugust 2026City of San DiegoContext only [48]
PHCC San Diego active member-company network140+ active members2026PHCC San Diego trade networkContext only [49]
PHCC affiliate membership explicitly provides access to contractorsAffiliate program offers direct access to active P-H-C contractors and businesses across San Diego2026PHCC San Diego trade networkContext only [49]
Greater San Diego Association of REALTORS professional network sizeApproximately 10,500 real-estate professionals2026San Diego County real-estate professional networkContext only [50]
San Diego Superior Court maintains a professional supervised-visitation provider listCourt-maintained PPSV list is provided to parties when professional supervised visitation is orderedCurrentSuperior Court of California, County of San DiegoContext only [51]
Kearny Mesa industrial total vacancy4.4%Q2 2026Kearny Mesa industrial submarketContext only [52]
Mira Mesa/Miramar industrial total vacancy8.7%Q2 2026Mira Mesa/Miramar industrial submarketContext only [52]

How to use the study

Study limitations

  • We modeled local fit, not financial performance.
  • Candidate-specific considerations are required, particularly for franchises requiring a physical presence.
  • Conditional factors may be shown but do not affect the published score until their applicability is established.

Methodology

How the franchise scores are calculated

01

Assess city conditions

We reviewed local measures that could affect franchise operations and recorded their sources, geographic scope and evidence quality.

02

Model the operating assumptions

For San Diego city, California, 45.6% of housing is in buildings with two or more units. The multifamily housing concentration adjustment contributed +0.34 points to FASTSIGNS and +0.51 to PuroClean, a 0.17-point difference from the same local input. [3] [5]

03

Apply modeled effects

Apply modeled effects at full or reduced provisional weight.

04

Highlight candidate-dependent effects

Keep candidate-specific effects outside the baseline score.

05

Test rank sensitivity

Remove one factor category at a time from every franchise and rerun scoring.

06

Generate output

Generate the data displayed on this page.

How we start out from a baseline

Every franchise starts at 70.00 points. Score differences come from modeled relationships. In San Diego, FASTSIGNS reached 71.340. Customer demand combined several local effects for a net +1.52 points. [23] [6] Hiring and staffing conditions totaled -0.18 points, led by Installation, maintenance and repair mean hourly wage at -0.18 points. [8]

Scores reflect sourced local data and modeled operating assumptions. Actual impacts may vary by franchise, location, and operator.

Calculation controls

The current model caps total local movement at Β±18.00 points. The score is not a percentage, probability, or estimate of investment quality.

relationship_max_effect Γ— city_condition_strength Γ— operating_exposure Γ— confidence_multiplier Γ— provenance_multiplier Γ— geographic_applicability Γ— profile_effect_multiplier Γ— eligibility_multiplier, followed by channel/modifier/correlation/family/factor/total controls

Score calibration

How relationship effects become score adjustments

For FASTSIGNS, the defense-linked institutional demand example uses 3.000 x 0.550 x 0.517 x 0.978 x 0.80, approximately +0.67 points before later controls. [23]

Local condition60 ships, 250 tenant commands, 26,000 sailors, 6,000 reservists, and 30,000 civilian personnel [23]Military installation scaleStrength 0.550 / 1.000
Operating exposuredefense-linked institutional demandFASTSIGNS weighted operating exposureExposure 0.517 / 1.000
Model calibration+3.00 pts ceilingEvidence/applicability Γ—0.978 Β· pre-cap +0.67 ptsRelationship-specific maximum
Score effect+0.67 ptsNo post-calibration control reduced this relationshipSource
Worked-example calibration inputsActual model values, not generic point bands
City-condition strength0.550 / 1.000
Operating exposure0.517 / 1.000
Evidence & applicabilityΓ—0.978
Relationship ceiling3.000 pts

The model does not use one universal Minor/Moderate/Strong point table. Relationship-specific max_effect values are the actual point ceilings, so publishing generic point bands would misstate the scoring system.

How factor rows are classified

Positive local adjustmentNegative local adjustmentMeasured; no meaningful local adjustmentEffect below the publication thresholdNot applicable to this operating modelCandidate considerationsNot included in the score

Model 0.10.0 Β· Compiler 0.35.61-bronx-top-three-copy Β· Report generated October 13, 2026 (site timezone)

Model governance

How this report is calculated and corrected

Calculation controls

Model designer
Thomas Jepsen

No franchise score is manually raised or lowered after calculation.

Model history

Study updates are versioned and dated to show development and assumptions used in calculations.

Corrections policy

Corrections trigger a model rerun. Scores are updated. Some visuals may be updated less frequently.

Source registry

External sources linked

  1. 1
    U.S. Census Bureau QuickFacts: San Diego city, California

    Used for: Population estimate, Population change since 2020, Population density, Household count, and Owner-occupied housing share

    Publisher
    U.S. Census Bureau
    Data period
    2020-2025 / 2020-2024 / 2022
    Scope
    San Diego city, California
    Accessed
    August 27, 2026
  2. 2
    U.S. Census Bureau QuickFacts: United States

    Used for: Population change since 2020, Owner-occupied housing share, Renter-occupied housing share, Median owner-occupied home value, and Median household income

    Publisher
    U.S. Census Bureau
    Data period
    2020-2025 / 2020-2024 / 2022
    Scope
    United States
    Accessed
    August 27, 2026
  3. 3
    ACS 2024 Selected Housing Characteristics (DP04), United States

    Used for: Detached single-family housing share and Housing in buildings with two or more units

    Publisher
    U.S. Census Bureau
    Data period
    2024
    Scope
    United States
    Accessed
    August 27, 2026
  4. 4
    San Diego, CA profile β€” ACS 2024 1-year estimates

    Used for: Housing-unit count and Recent-mover share

    Publisher
    Census Reporter
    Data period
    2024
    Scope
    San Diego city, California
    Accessed
    August 27, 2026
  5. 5
    San Diego, CA Population & Demographics (ACS 2019-2023)

    Used for: Renter-occupied housing share, Detached single-family housing share, Housing in buildings with two or more units, Median year built, and Worked-from-home share

    Publisher
    USCivicData
    Data period
    2019-2023 ACS 5-year
    Scope
    San Diego city, California
    Accessed
    August 27, 2026
  6. 6
    City of San Diego Permits Nearly 8,800 New Homes in 2024

    Used for: Housing units permitted

    Publisher
    City of San Diego
    Published
    September 29, 2025
    Data period
    2024 and 2023-2024
    Scope
    San Diego city, California
    Accessed
    August 27, 2026
  7. 7
    Annual Progress Report Housing Data Explorer 2024
    Publisher
    SANDAG
    Data period
    2024
    Scope
    San Diego region
    Accessed
    August 27, 2026
  8. 8
    Occupational Employment and Wages in San Diego-Chula Vista-Carlsbad β€” May 2025

    Used for: Food preparation and serving mean hourly wage, Mean hourly wage for building and grounds occupations, Office and administrative support mean hourly wage, Construction and extraction mean hourly wage, and Installation, maintenance and repair mean hourly wage

    Publisher
    U.S. Bureau of Labor Statistics
    Published
    July 9, 2026
    Data period
    May 2025
    Scope
    San Diego-Chula Vista-Carlsbad MSA (San Diego County)
    Accessed
    August 27, 2026
  9. 9
    Metropolitan Area Employment and Unemployment β€” June 2026

    Used for: Unemployment rate

    Publisher
    U.S. Bureau of Labor Statistics
    Published
    August 5, 2026
    Data period
    June 2026
    Scope
    U.S. metropolitan areas including San Diego-Chula Vista-Carlsbad
    Accessed
    August 27, 2026
  10. 10
    Employment up in 10 large metro areas, down in 2, over year ended June 2026
    Publisher
    U.S. Bureau of Labor Statistics
    Published
    August 13, 2026
    Data period
    June 2025-June 2026
    Scope
    Large U.S. metropolitan areas including San Diego-Chula Vista-Carlsbad
    Accessed
    August 27, 2026
  11. 11
    Earned Sick Leave and Minimum Wage Ordinance

    Used for: Statutory minimum wage

    Publisher
    City of San Diego
    Data period
    2026
    Scope
    City of San Diego
    Accessed
    August 27, 2026
  12. 12
    California Minimum Wage

    Used for: Statutory minimum wage

    Publisher
    California Department of Industrial Relations
    Data period
    2026
    Scope
    California
    Accessed
    August 27, 2026
  13. 13
    Apply for a Business Tax Certificate / Business Tax Rates and Fees

    Used for: Business Tax Certificate requirement and base fee

    Publisher
    City of San Diego
    Data period
    2026
    Scope
    City of San Diego
    Accessed
    August 27, 2026
  14. 14
    Business Tax Certificates

    Used for: Active business certificate dataset availability

    Publisher
    City of San Diego Open Data Portal / City Treasurer
    Data period
    Updated daily through 2026-08-27
    Scope
    City of San Diego
    Accessed
    August 27, 2026
  15. 15
    Water and Sewer Rate Adjustments
    Publisher
    City of San Diego Public Utilities
    Data period
    2026
    Scope
    City of San Diego Public Utilities service area
    Accessed
    August 27, 2026
  16. 16
    Cross-Connection Control and Backflow Prevention

    Used for: Commercial backflow prevention requirement

    Publisher
    City of San Diego Public Utilities
    Data period
    Current as accessed 2026-08-27
    Scope
    City of San Diego Public Utilities service area
    Accessed
    August 27, 2026
  17. 17
    Food Establishment Wastewater Discharge (FEWD) Program

    Used for: Food-establishment wastewater discharge permitting requirement and Food establishments in FEWD program

    Publisher
    City of San Diego Public Utilities
    Data period
    Current as accessed 2026-08-27
    Scope
    City of San Diego
    Accessed
    August 27, 2026
  18. 18
    SDG&E 2028-2031 Portfolio Plan β€” January 1, 2026 current effective average rate table
    Publisher
    San Diego Gas & Electric
    Published
    March 16, 2026
    Data period
    January 1, 2026 current effective rates
    Scope
    SDG&E service area
    Accessed
    August 27, 2026
  19. 19
    Electric Power Annual β€” 2024 state average retail electricity prices
    Publisher
    U.S. Energy Information Administration
    Published
    October 16, 2025
    Data period
    2024
    Scope
    California and United States
    Accessed
    August 27, 2026
  20. 20
    San Diego Tourism Fast Facts | 2026

    Used for: Hotel rooms in City of San Diego, Visitor volume, and San Diego Convention Center primary-convention attendees

    Publisher
    San Diego Tourism Authority
    Published
    April 30, 2026
    Data period
    Calendar 2025 / FY2025
    Scope
    San Diego region with city-specific lodging/TOT/convention fields
    Accessed
    August 27, 2026
  21. 21
    San Diego International Airport Sets New Passenger Record in 2025

    Used for: Annual airport passengers

    Publisher
    San Diego County Regional Airport Authority
    Published
    February 18, 2026
    Data period
    2025
    Scope
    San Diego International Airport
    Accessed
    August 27, 2026
  22. 22
    Maritime Month β€” Port of San Diego cargo statistics
    Publisher
    Port of San Diego
    Data period
    FY2024
    Scope
    Port of San Diego / San Diego Bay
    Accessed
    August 27, 2026
  23. 23
    Naval Base San Diego Public Affairs β€” installation profile
    Publisher
    U.S. Navy, Commander Navy Region Southwest
    Data period
    Current as accessed 2026-08-27
    Scope
    Naval Base San Diego
    Accessed
    August 27, 2026
  24. 24
    About UC San Diego

    Used for: University of California San Diego enrollment

    Publisher
    University of California San Diego
    Data period
    Fall 2024 / FY2023-24
    Scope
    UC San Diego campus
    Accessed
    August 27, 2026
  25. 25
    University census confirms record-breaking SDSU enrollment for 2025-26

    Used for: SDSU and Imperial Valley combined enrollment

    Publisher
    San Diego State University
    Published
    October 29, 2025
    Data period
    Fall 2025
    Scope
    SDSU and SDSU Imperial Valley combined
    Accessed
    August 27, 2026
  26. 26
    Southern California Earthquake Hazards
    Publisher
    U.S. Geological Survey
    Published
    November 10, 2022
    Data period
    Current durable hazard characterization
    Scope
    Southern California including San Diego metropolitan area
    Accessed
    August 27, 2026
  27. 27
    Local Responsibility Areas 2025 Updated Fire Hazard Severity Zone Map

    Used for: Mapped 2025 fire hazard severity zones

    Publisher
    City of San Diego Fire-Rescue Department
    Published
    August 30, 2025
    Data period
    2025-2026
    Scope
    City of San Diego fire hazard severity zones
    Accessed
    August 27, 2026
  28. 28
    FEMA: Flood Insurance Rate Map
    Publisher
    City of San Diego / FEMA
    Data period
    Current mapped flood hazard
    Scope
    City of San Diego flood hazard areas
    Accessed
    August 27, 2026
  29. 29
    8-Hour Ozone (2015) Nonattainment Areas β€” current as July 31, 2026

    Used for: Ozone nonattainment classification

    Publisher
    U.S. Environmental Protection Agency
    Published
    July 31, 2026
    Data period
    Current as 2026-07-31
    Scope
    San Diego County
    Accessed
    August 27, 2026
  30. 30
    San Diego Climate
    Publisher
    National Weather Service San Diego
    Data period
    Long-term climate summary; tables include 1948-1990 period of record
    Scope
    San Diego / Lindbergh Field
    Accessed
    August 27, 2026
  31. 31
    Truck Route and Street Prohibition Map
    Publisher
    City of San Diego
    Data period
    Current as accessed 2026-08-27
    Scope
    San Diego communities south of downtown
    Accessed
    August 27, 2026
  32. 32
    Parking Enforcement & Rules

    Used for: Heavy-duty commercial vehicle residential parking restriction

    Publisher
    City of San Diego
    Data period
    Current as accessed 2026-08-27
    Scope
    City of San Diego
    Accessed
    August 27, 2026
  33. 33
    San Diego Office Figures 2026 Q2
    Publisher
    CBRE Research
    Published
    July 14, 2026
    Data period
    Q2 2026
    Scope
    San Diego metro office market
    Accessed
    August 27, 2026
  34. 34
    San Diego Industrial Figures 2026 Q2
    Publisher
    CBRE Research
    Published
    July 14, 2026
    Data period
    Q2 2026
    Scope
    San Diego metro industrial market
    Accessed
    August 27, 2026
  35. 35
    Vendor Registration

    Used for: City bid submission requires vendor registration

    Publisher
    City of San Diego Purchasing & Contracting
    Data period
    Current as accessed 2026-08-27
    Scope
    City of San Diego procurement jurisdiction
    Accessed
    August 27, 2026
  36. 36
    Doing Business With The Port

    Used for: Port bidding requires PlanetBids vendor registration

    Publisher
    Port of San Diego
    Data period
    Current as accessed 2026-08-27
    Scope
    Port of San Diego procurement jurisdiction
    Accessed
    August 27, 2026
  37. 37
    Phase 1 Projects

    Used for: Pure Water Phase 1 active project count

    Publisher
    City of San Diego Public Utilities Department
    Data period
    Phase 1 construction current in 2026
    Scope
    Morena, Bay Park, Bay Ho, Clairemont, University City, Miramar and Scripps Ranch
    Accessed
    August 27, 2026
  38. 38
    North City Pure Water Pipeline, Dechlorination Facility and Subaqueous Pipeline

    Used for: Current Pure Water nighttime work on Eastgate Mall

    Publisher
    City of San Diego Public Utilities Department
    Data period
    Construction notices through July 2026
    Scope
    Eastgate Mall and Miramar-area construction corridor
    Accessed
    August 27, 2026
  39. 39
    Sign Permit

    Used for: Sign projects can trigger historic review and Potential historic-resource age screening threshold

    Publisher
    City of San Diego Development Services Department
    Data period
    Current as accessed 2026-08-27
    Scope
    City of San Diego
    Accessed
    August 27, 2026
  40. 40
    Downtown Regulations & Policies

    Used for: Gaslamp Quarter uses district-specific sign rules

    Publisher
    City of San Diego Development Services Department
    Data period
    Current as accessed 2026-08-27
    Scope
    Downtown San Diego including Gaslamp Quarter
    Accessed
    August 27, 2026
  41. 41
    Historic Preservation Regulations and Ordinances

    Used for: Sign projects can trigger historic review

    Publisher
    City of San Diego Planning Department
    Data period
    Current as accessed 2026-08-27
    Scope
    City of San Diego historic resources and districts
    Accessed
    August 27, 2026
  42. 42
    San Diego Municipal Code Chapter 14, Article 1, Division 6, Section 141.0607

    Used for: Drive-through restaurants are conditional in designated base zones, Drive-through minimum queue spaces, and Drive-through additional pre-order queue length

    Publisher
    City of San Diego
    Data period
    Current code text reviewed 2026-08-27
    Scope
    City of San Diego base zoning districts
    Accessed
    August 27, 2026
  43. 43
    Adopted Land Development Code Updates
    Publisher
    City of San Diego Planning Department
    Published
    June 15, 2026
    Data period
    2026 Land Development Code update
    Scope
    City of San Diego, with separate Coastal Overlay Zone effective status
    Accessed
    August 27, 2026
  44. 44
    Building Energy Benchmarking

    Used for: Commercial-building benchmarking size threshold and Annual building-energy benchmarking filing deadline

    Publisher
    City of San Diego Planning Department
    Data period
    2026 benchmarking cycle
    Scope
    City of San Diego covered buildings
    Accessed
    August 27, 2026
  45. 45
    Floodplain Review Status

    Used for: Elevation Certificate required for new or substantially improved insurable structures in SFHAs and Nonresidential floodproofing alternative requires certification

    Publisher
    City of San Diego Stormwater Department
    Data period
    Current as accessed 2026-08-27
    Scope
    Special Flood Hazard Areas in the City of San Diego
    Accessed
    August 27, 2026
  46. 46
    Floodplain Management

    Used for: Nonresidential floodproofing alternative requires certification

    Publisher
    City of San Diego Stormwater Department
    Data period
    Current as accessed 2026-08-27
    Scope
    City of San Diego Special Flood Hazard Areas
    Accessed
    August 27, 2026
  47. 47
    Public Spaces - Development Impact Fees

    Used for: Citywide Development Impact Fees apply to new development

    Publisher
    City of San Diego Planning Department
    Data period
    Current citywide DIF framework as accessed 2026-08-27
    Scope
    City of San Diego
    Accessed
    August 27, 2026
  48. 48
    Fee Schedule for Construction Permits-Structures, Information Bulletin 501

    Used for: Citywide Development Impact Fees apply to new development and New nonresidential development can trigger Housing Trust Fund fees

    Publisher
    City of San Diego Development Services Department
    Published
    August 1, 2026
    Data period
    August 2026
    Scope
    City of San Diego
    Accessed
    August 27, 2026
  49. 49
    Association / Member Directory

    Used for: PHCC San Diego active member-company network and PHCC affiliate membership explicitly provides access to contractors

    Publisher
    PHCC San Diego
    Data period
    Current 2026 membership
    Scope
    San Diego area plumbing, heating and cooling trade network
    Accessed
    August 27, 2026
  50. 50
    SDAR Supports 2026 Ballot Initiative to Expand Middle-Class Homeownership Opportunities

    Used for: Greater San Diego Association of REALTORS professional network size

    Publisher
    Greater San Diego Association of REALTORS
    Published
    May 7, 2026
    Data period
    2026
    Scope
    San Diego County real-estate professional network
    Accessed
    August 27, 2026
  51. 51
    Professional Providers of Supervised Visitation (PPSV) List

    Used for: San Diego Superior Court maintains a professional supervised-visitation provider list

    Publisher
    Superior Court of California, County of San Diego
    Data period
    Current as accessed 2026-08-27
    Scope
    San Diego County judicial district
    Accessed
    August 27, 2026
  52. 52
    San Diego Industrial Market Report | Q2 2026

    Used for: Kearny Mesa industrial total vacancy and Mira Mesa/Miramar industrial total vacancy

    Publisher
    Kidder Mathews
    Data period
    Q2 2026
    Scope
    San Diego industrial submarkets
    Accessed
    August 27, 2026

Apply the analysis to your situation

Review your franchising goals with a team member.

Request a private franchise review

Twenty Twenty-Five

Take Free Franchise Match Quiz