#1Tier 3 · Mixed modeled alignment70.60
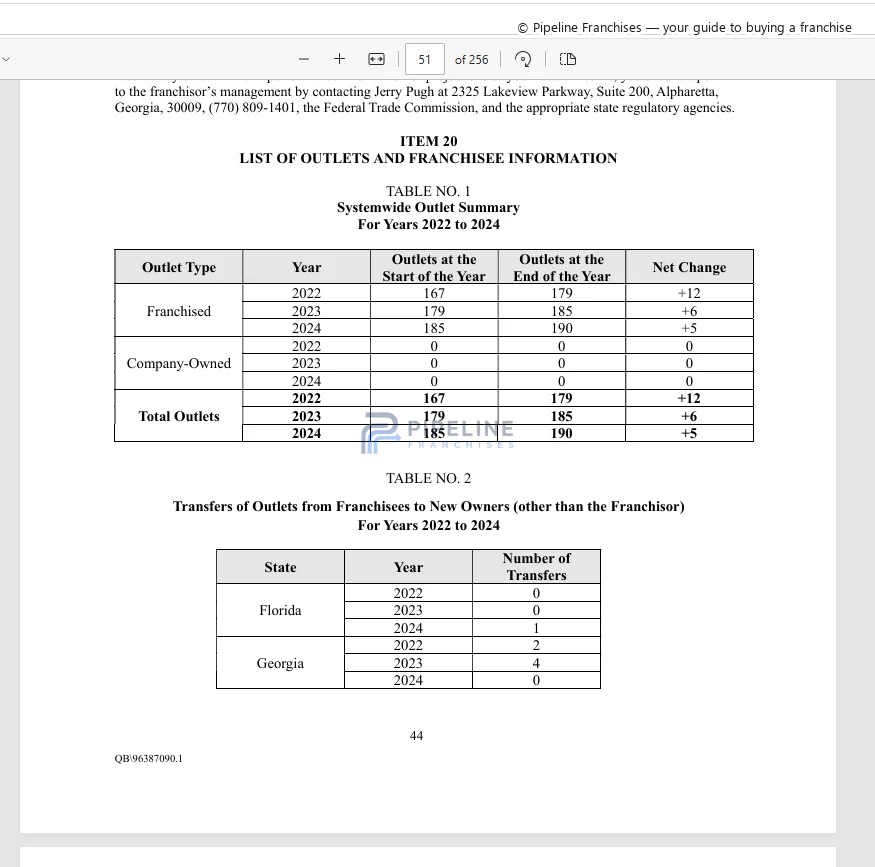
City Wide Facility Solutions
Integrated Facility Management · sales-led B2B integrated facility-management coordinator
Advantage +0.33 pts 41.5% of housing units in structures with 2+ units multifamily…Constraint -0.10 pts general operating-friction guardrail
Rank sensitivity: Highly sensitive
Why it ranks here
Score-changing local relationships are grouped by factor. Each factor subtotal shows the net contribution after model controls.
Baseline70.00
Advantages+0.70 pts
Constraints-0.10 pts
Net local movement+0.603 pts
Final score70.60
5 material local relationships changed this score: 4 advantages and 1 constraint.
Largest individual score driver41.5% of housing units in structures with 2+ units multifamily housing share+0.33 pts
Factor
Target-market demand
Factor subtotal+0.60 pts
| Scored local driver | Effect | Evidence |
|---|
| 41.5% of housing units in structures with 2+ units multifamily housing shareLargest driverRelationship test: Rank #1 to #2 without this driver. | +0.33 pts | ModerateEvidence |
|---|
| 53.4% renter-occupied housing share | +0.15 pts | HighEvidence |
|---|
| 3,630,410 passengers mcGhee Tyson Airport annual passengers | +0.12 pts | ModerateEvidence |
|---|
Factor
Labor and staffing friction
Factor subtotal+0.10 pts
| Scored local driver | Effect | Evidence |
|---|
| $15.31/hour food preparation and serving mean hourly wage | +0.10 pts | HighEvidence |
|---|
Factor
Regulatory and operating friction
Factor subtotal-0.10 pts
| Scored local driver | Effect | Evidence |
|---|
| general operating-friction guardrail | -0.10 pts | ModerateEvidence |
|---|
Overall local score movement+0.603 ptsThis is the accounting total after all factor subtotals and model controls.
Potential candidate-specific adjustmentsThese relationships depend on territory, site, customer mix, project, or another candidate-specific selection. They stay outside the baseline city score until that selection is known; the model should then be rerun to produce the candidate-adjusted score.
Potential candidate constraintInstitutional procurement and vendor-onboarding frictionReferral ecosystem
Applicability depends on the selected procurement jurisdiction
Potential candidate constraintInstitutional procurement and vendor-onboarding frictionReferral ecosystem
Applicability depends on the selected procurement jurisdiction
Relationship effects are shown individually. Factor net values are secondary subtotals. Any scored relationship below the public materiality threshold is reconciled in the accounting residual.
Full calculation and evidence confidence
Audit layer
Full factor ledger
Full score ledger
Every factor is classified. Factor values here are net totals; the score-changing relationship table above preserves material positive and negative drivers even when they offset inside the same factor.
| Neutral model baseline | 70.00 |
|---|
| Target-market demand | +0.60 |
|---|
| Property replacement-cycle demand | Not included in the score |
|---|
| Competitive environment | Not included in the score |
|---|
| Labor and staffing friction | +0.10 |
|---|
| Transportation, routing, and parking | Potential candidate-specific adjustment |
|---|
| Real estate and site feasibility | Not applicable to this operating model |
|---|
| Sales and customer acquisition | Not included in the score |
|---|
| Referral ecosystem | Not applicable to this operating model |
|---|
| Territory quality | Not included in the score |
|---|
| Regulatory and operating friction | -0.10 |
|---|
| Full-precision calculated score | 70.603 |
|---|
| Published local-market alignment | 70.60 |
|---|
Factor calculations use full precision. Contributions and published scores are displayed to two decimal places; ranking order uses the full-precision score.
Evidence confidence
- City Modifier Evidence
- Strong
- Factor Research Coverage
- Limited
- Franchise-profile completeness
- Strong
- Source-evidence confidence
- Strong
- Geographic applicability
- Strong
- Overall evidence confidence
- Moderate evidence confidence
- Largest absolute effect
- Target-market demand +0.60 pts
- Tested rank range
- #1–#10
#2Tier 3 · Mixed modeled alignment70.57
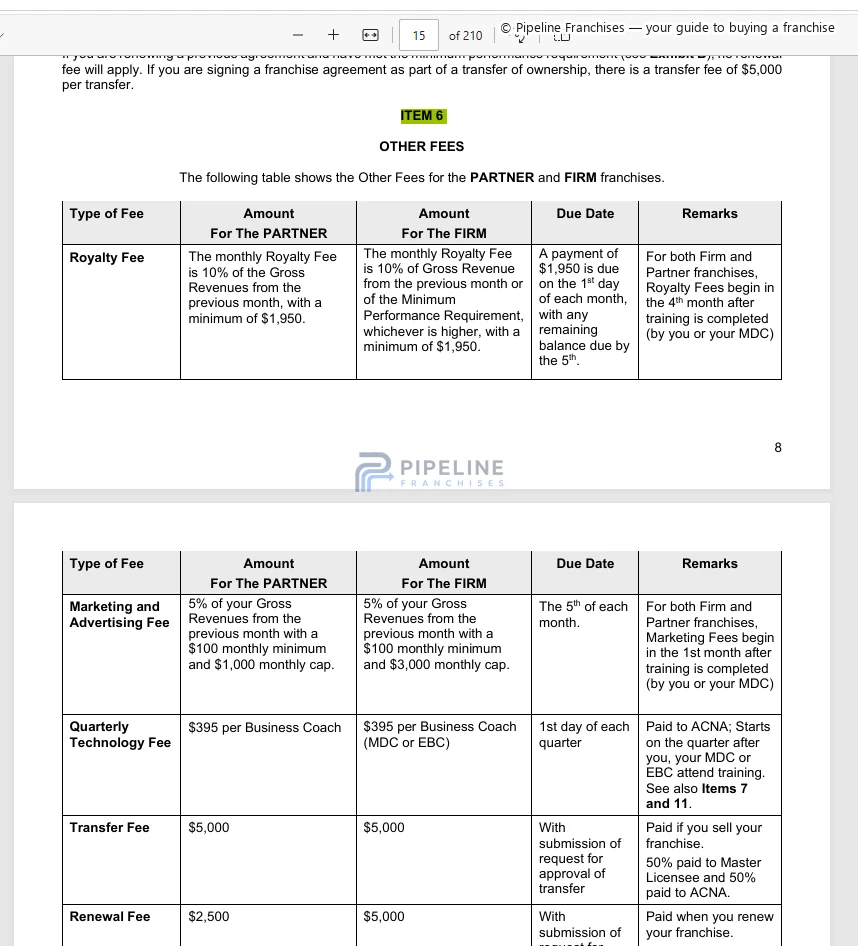
JAN-PRO International
Franchise Consulting Training · regional franchisor business support and commercial account development office
Initial investment: $130,000–$421,500 · Item 7 evidence below
Advantage +0.23 pts AAGK comprises apartment owners and managers, communities, and…Constraint -0.10 pts general operating-friction guardrail
Rank sensitivity: Stable
Why it ranks here
Score-changing local relationships are grouped by factor. Each factor subtotal shows the net contribution after model controls.
Baseline70.00
Advantages+0.71 pts
Constraints-0.15 pts
Net local movement+0.566 pts
Final score70.57
6 material local relationships changed this score: 5 advantages and 1 constraint. 1 additional scored relationship fell below the public row threshold and reconcile to -0.049 pts.
Largest individual score driverAAGK comprises apartment owners and managers, communities, and vendors serving multifamily housing in Knox and surrounding counties. aAGK multifamily professional audience+0.23 pts
Factor
Target-market demand
Factor subtotal+0.36 pts
| Scored local driver | Effect | Evidence |
|---|
| 41.5% of housing units in structures with 2+ units multifamily housing share | +0.23 pts | ModerateEvidence |
|---|
| 53.4% renter-occupied housing share | +0.09 pts | HighEvidence |
|---|
| 3,630,410 passengers mcGhee Tyson Airport annual passengers | +0.09 pts | ModerateEvidence |
|---|
Factor
Referral ecosystem
Factor subtotal+0.23 pts
| Scored local driver | Effect | Evidence |
|---|
| AAGK comprises apartment owners and managers, communities, and vendors serving multifamily housing in Knox and surrounding counties. aAGK multifamily professional audienceLargest driverRelationship test: Rank #2 to #3 without this driver. | +0.23 pts | HighEvidence |
|---|
Factor
Regulatory and operating friction
Factor subtotal-0.10 pts
| Scored local driver | Effect | Evidence |
|---|
| general operating-friction guardrail | -0.10 pts | ModerateEvidence |
|---|
Factor
Labor and staffing friction
Factor subtotal+0.07 pts
| Scored local driver | Effect | Evidence |
|---|
| $15.31/hour food preparation and serving mean hourly wage | +0.07 pts | HighEvidence |
|---|
Overall local score movement+0.566 ptsThis is the accounting total after all factor subtotals and model controls.
Potential candidate-specific adjustmentsThese relationships depend on territory, site, customer mix, project, or another candidate-specific selection. They stay outside the baseline city score until that selection is known; the model should then be rerun to produce the candidate-adjusted score.
Potential candidate constraintInstitutional procurement and vendor-onboarding frictionReferral ecosystem
Applicability depends on the selected procurement jurisdiction
Potential candidate constraintInstitutional procurement and vendor-onboarding frictionReferral ecosystem
Applicability depends on the selected procurement jurisdiction
Relationship effects are shown individually. Factor net values are secondary subtotals. Any scored relationship below the public materiality threshold is reconciled in the accounting residual.
Franchise evidence
Source material assessed
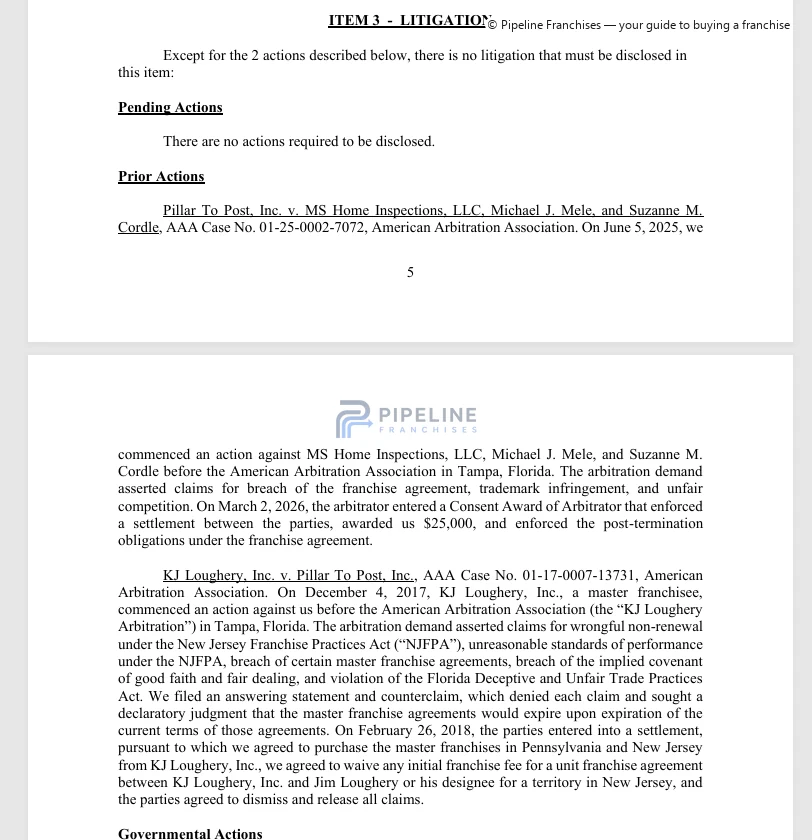
Item 3 — Litigation
1 imageItem 6 — Other Fees
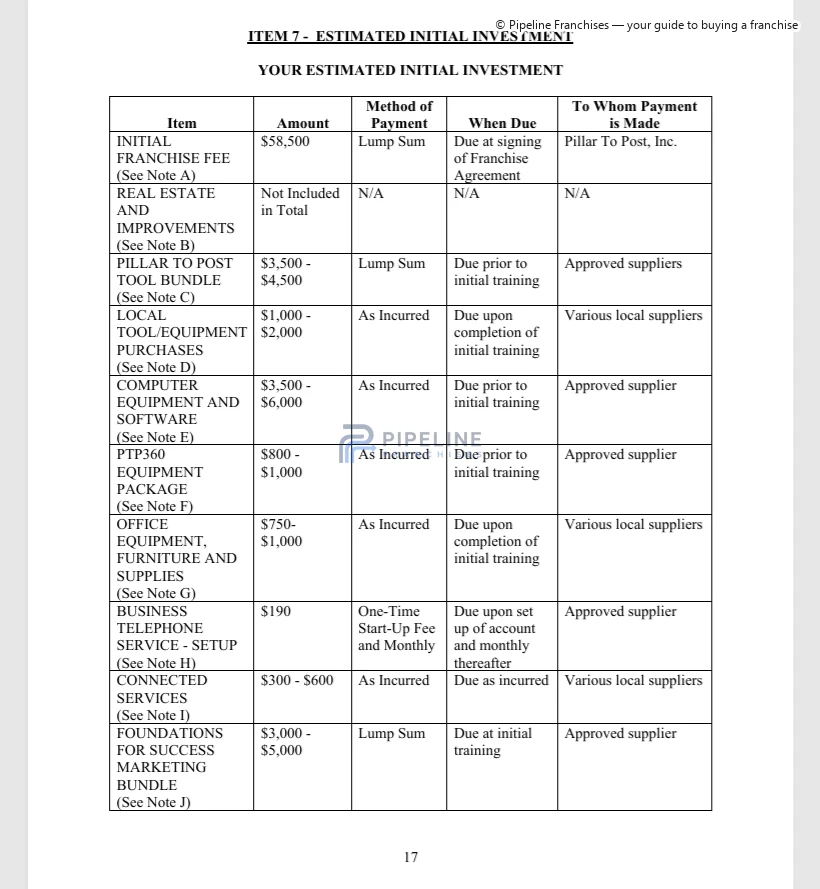
1 imageItem 7 — Estimated Initial Investment
1 imageItem 12 — Territory
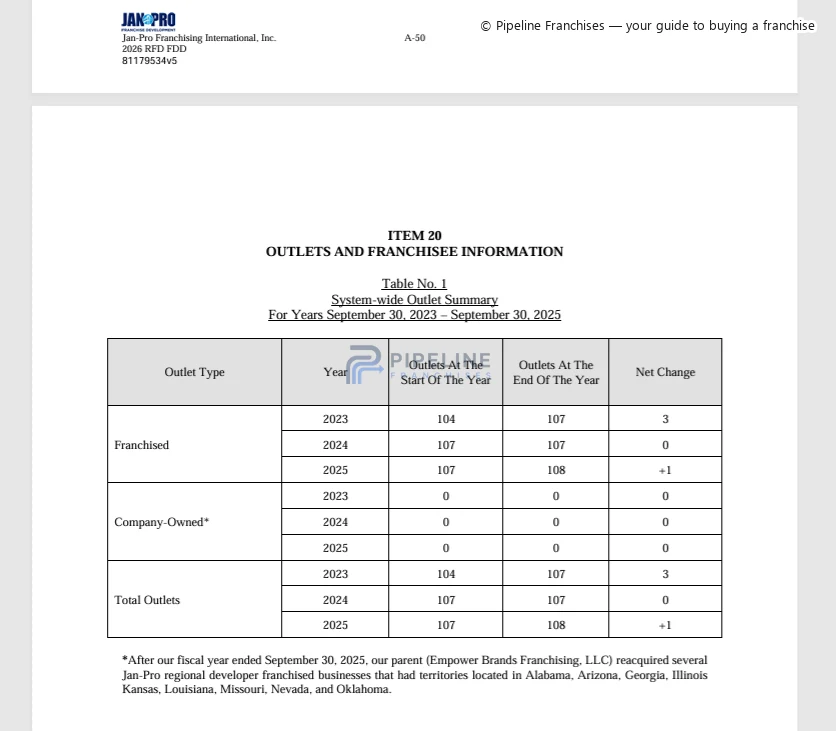
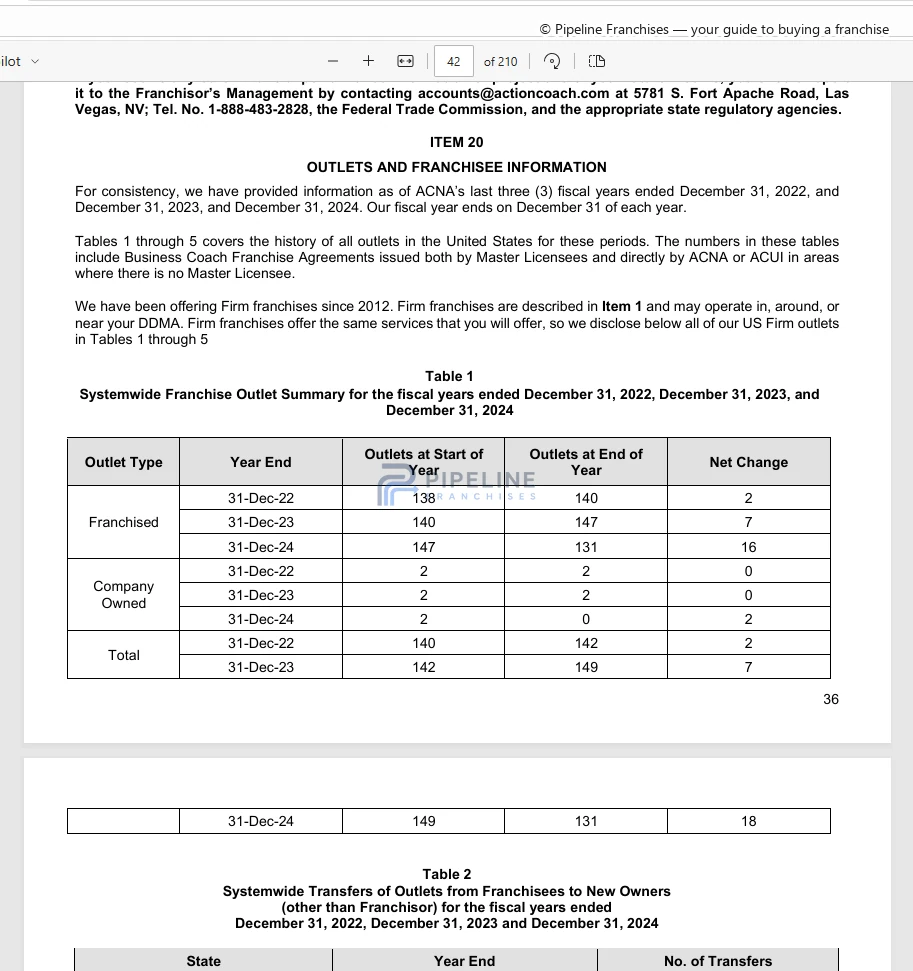
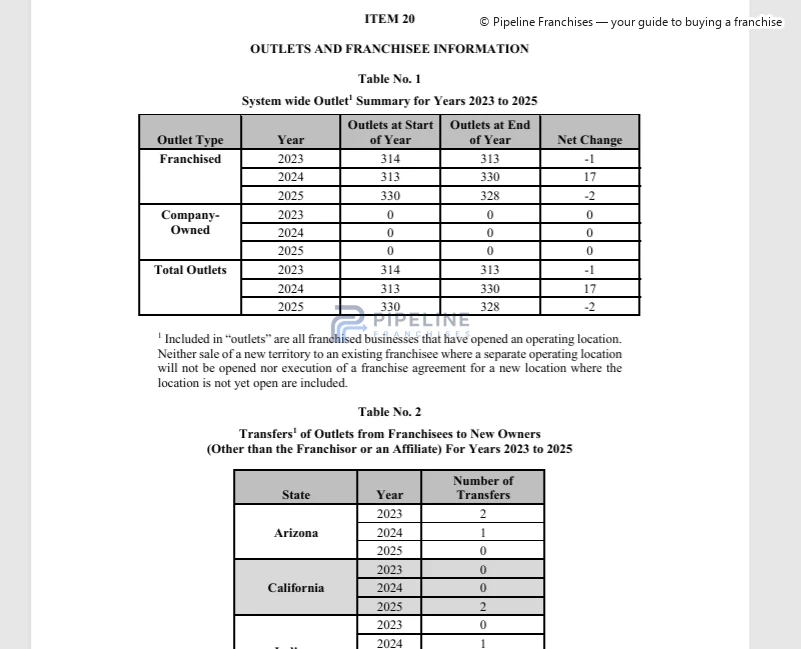
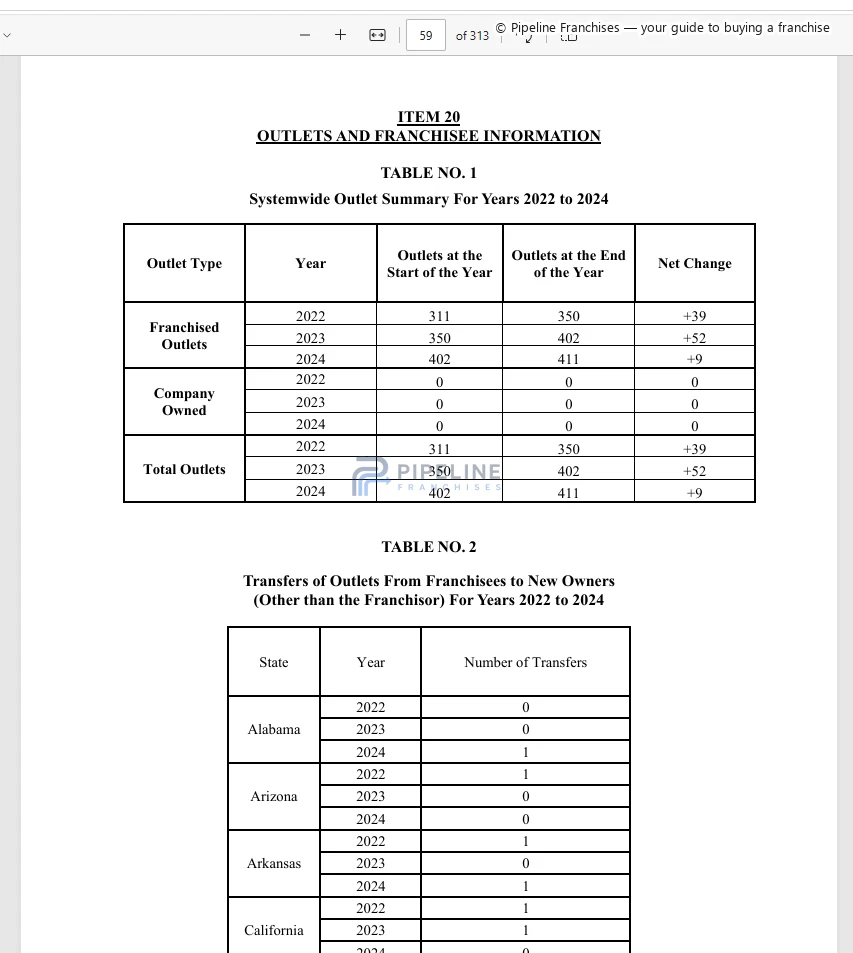
1 imageItem 20 — Outlets and Franchise Information
1 imageFull calculation and evidence confidence
Audit layer
Full factor ledger
Full score ledger
Every factor is classified. Factor values here are net totals; the score-changing relationship table above preserves material positive and negative drivers even when they offset inside the same factor.
| Neutral model baseline | 70.00 |
|---|
| Target-market demand | +0.36 |
|---|
| Property replacement-cycle demand | Not included in the score |
|---|
| Competitive environment | Not included in the score |
|---|
| Labor and staffing friction | +0.07 |
|---|
| Transportation, routing, and parking | Potential candidate-specific adjustment |
|---|
| Real estate and site feasibility | Not applicable to this operating model |
|---|
| Sales and customer acquisition | Not included in the score |
|---|
| Referral ecosystem | +0.23 |
|---|
| Territory quality | Not included in the score |
|---|
| Regulatory and operating friction | -0.10 |
|---|
| Full-precision calculated score | 70.566 |
|---|
| Published local-market alignment | 70.57 |
|---|
Factor calculations use full precision. Contributions and published scores are displayed to two decimal places; ranking order uses the full-precision score.
Evidence confidence
- City Modifier Evidence
- Strong
- Factor Research Coverage
- Limited
- Franchise-profile completeness
- Strong
- Source-evidence confidence
- Strong
- Geographic applicability
- Strong
- Overall evidence confidence
- Moderate evidence confidence
- Largest absolute effect
- Target-market demand +0.36 pts
- Tested rank range
- #2–#3
#3Tier 3 · Mixed modeled alignment70.37
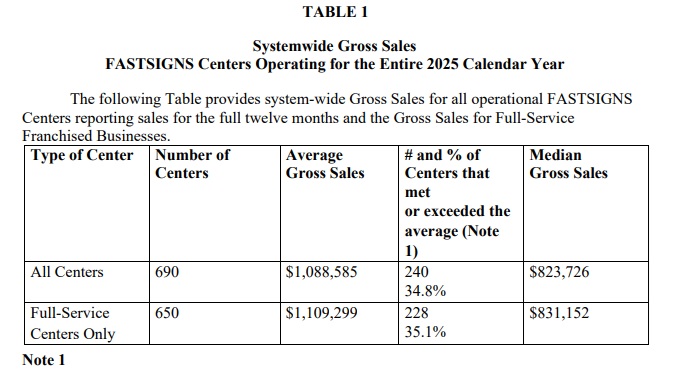
FASTSIGNS
Signs & Graphics · b2b fixed center sign graphics production sales and installation
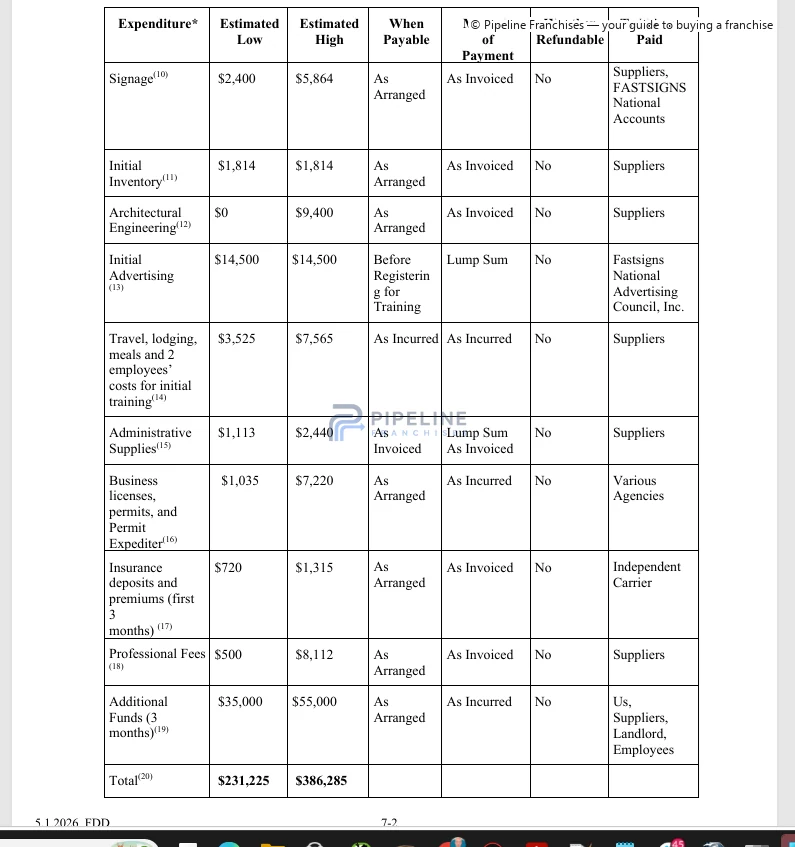
Initial investment: $231,226–$386,285 · Item 7 evidence below
Advantage +0.31 pts 397 permits building permits issuedConstraint -0.28 pts 1.9% industrial vacancy rate
Rank sensitivity: Highly sensitive
Why it ranks here
Score-changing local relationships are grouped by factor. Each factor subtotal shows the net contribution after model controls.
Baseline70.00
Advantages+0.79 pts
Constraints-0.42 pts
Net local movement+0.374 pts
Final score70.37
7 material local relationships changed this score: 5 advantages and 2 constraints.
Largest individual score driver397 permits building permits issued+0.31 pts
Factor
Target-market demand
Factor subtotal+0.61 pts
| Scored local driver | Effect | Evidence |
|---|
| 397 permits building permits issuedLargest driverRelationship test: Rank #3 to #4 without this driver. | +0.31 pts | ModerateEvidence |
|---|
| 41.5% of housing units in structures with 2+ units multifamily housing share | +0.17 pts | ModerateEvidence |
|---|
| 53.4% renter-occupied housing share | +0.07 pts | HighEvidence |
|---|
| 3,630,410 passengers mcGhee Tyson Airport annual passengers | +0.06 pts | ModerateEvidence |
|---|
Factor
Real estate and site feasibility
Factor subtotal-0.28 pts
| Scored local driver | Effect | Evidence |
|---|
| 1.9% industrial vacancy rate | -0.28 pts | ModerateEvidence |
|---|
Factor
Labor and staffing friction
Factor subtotal+0.18 pts
| Scored local driver | Effect | Evidence |
|---|
| $15.31/hour food preparation and serving mean hourly wage | +0.18 pts | HighEvidence |
|---|
Factor
Regulatory and operating friction
Factor subtotal-0.14 pts
| Scored local driver | Effect | Evidence |
|---|
| All work that disturbs or changes land requires a City of Knoxville site development permit. site-development permit required for land disturbance | -0.14 pts | HighEvidence |
|---|
Overall local score movement+0.374 ptsThis is the accounting total after all factor subtotals and model controls.
Potential candidate-specific adjustmentsThese relationships depend on territory, site, customer mix, project, or another candidate-specific selection. They stay outside the baseline city score until that selection is known; the model should then be rerun to produce the candidate-adjusted score.
Potential candidate constraintInstitutional procurement and vendor-onboarding frictionReferral ecosystem
Applicability depends on the selected procurement jurisdiction
Potential candidate constraintInstitutional procurement and vendor-onboarding frictionReferral ecosystem
Applicability depends on the selected procurement jurisdiction
Relationship effects are shown individually. Factor net values are secondary subtotals. Any scored relationship below the public materiality threshold is reconciled in the accounting residual.
Franchise evidence
Source material assessed
Item 3 — Litigation
1 imageItem 6 — Other Fees
1 imageItem 7 — Estimated Initial Investment
2 imagesItem 12 — Territory
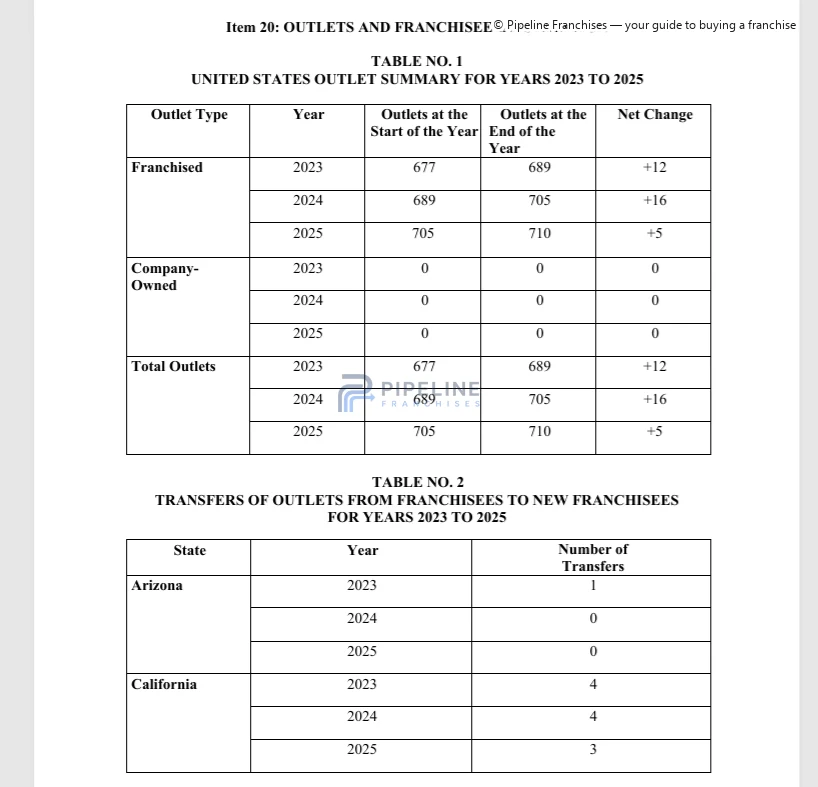
1 imageItem 20 — Outlets and Franchise Information
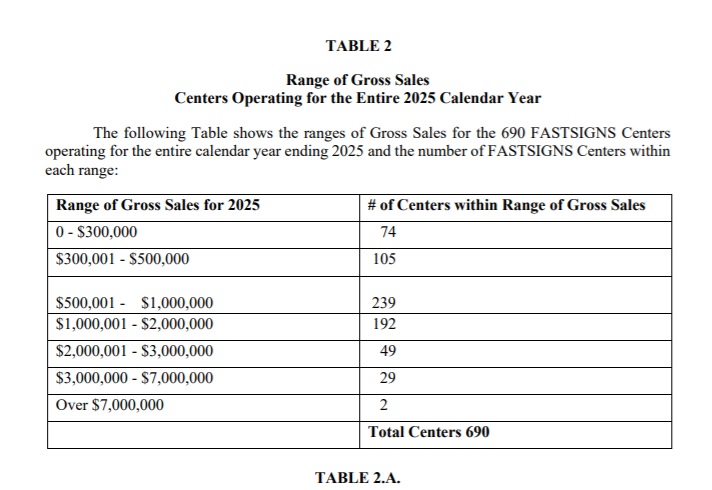
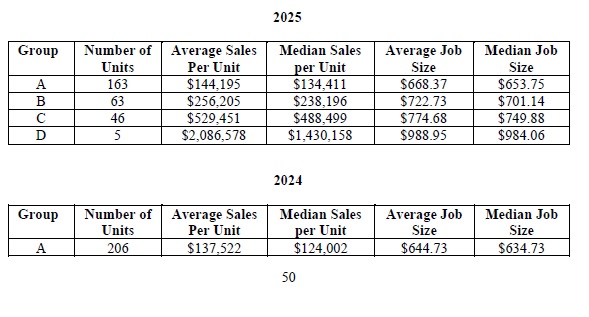
1 imageItem 19 — Financial Performance Representation
2 imagesAdditional brand source material assessed
3 sourcesFull calculation and evidence confidence
Audit layer
Full factor ledger
Full score ledger
Every factor is classified. Factor values here are net totals; the score-changing relationship table above preserves material positive and negative drivers even when they offset inside the same factor.
| Neutral model baseline | 70.00 |
|---|
| Target-market demand | +0.61 |
|---|
| Property replacement-cycle demand | Not included in the score |
|---|
| Competitive environment | Not included in the score |
|---|
| Labor and staffing friction | +0.18 |
|---|
| Transportation, routing, and parking | Potential candidate-specific adjustment |
|---|
| Real estate and site feasibility | -0.28 |
|---|
| Sales and customer acquisition | Not included in the score |
|---|
| Referral ecosystem | Not applicable to this operating model |
|---|
| Territory quality | Not included in the score |
|---|
| Regulatory and operating friction | -0.14 |
|---|
| Full-precision calculated score | 70.374 |
|---|
| Published local-market alignment | 70.37 |
|---|
Factor calculations use full precision. Contributions and published scores are displayed to two decimal places; ranking order uses the full-precision score.
Evidence confidence
- City Modifier Evidence
- Strong
- Factor Research Coverage
- Limited
- Franchise-profile completeness
- Strong
- Source-evidence confidence
- Strong
- Geographic applicability
- Strong
- Overall evidence confidence
- Moderate evidence confidence
- Largest absolute effect
- Target-market demand +0.61 pts
- Tested rank range
- #1–#13
#4Tier 3 · Mixed modeled alignment70.29
ActionCOACH
Business Coaching · home-based B2B business coaching and executive advisory franchise
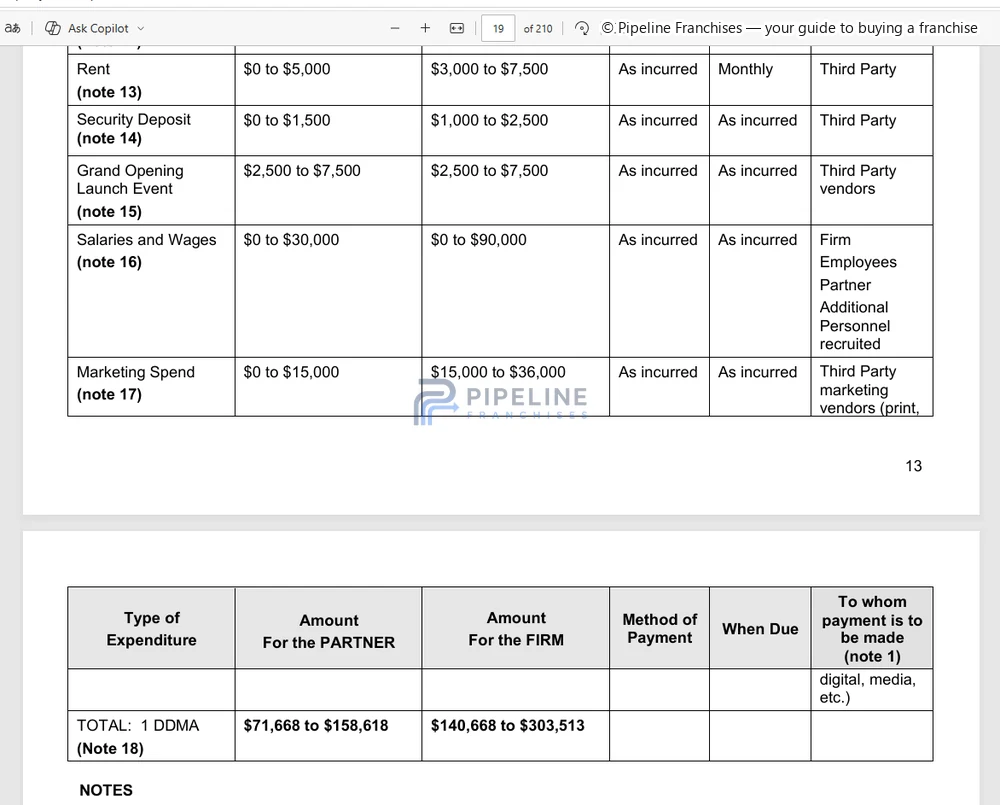
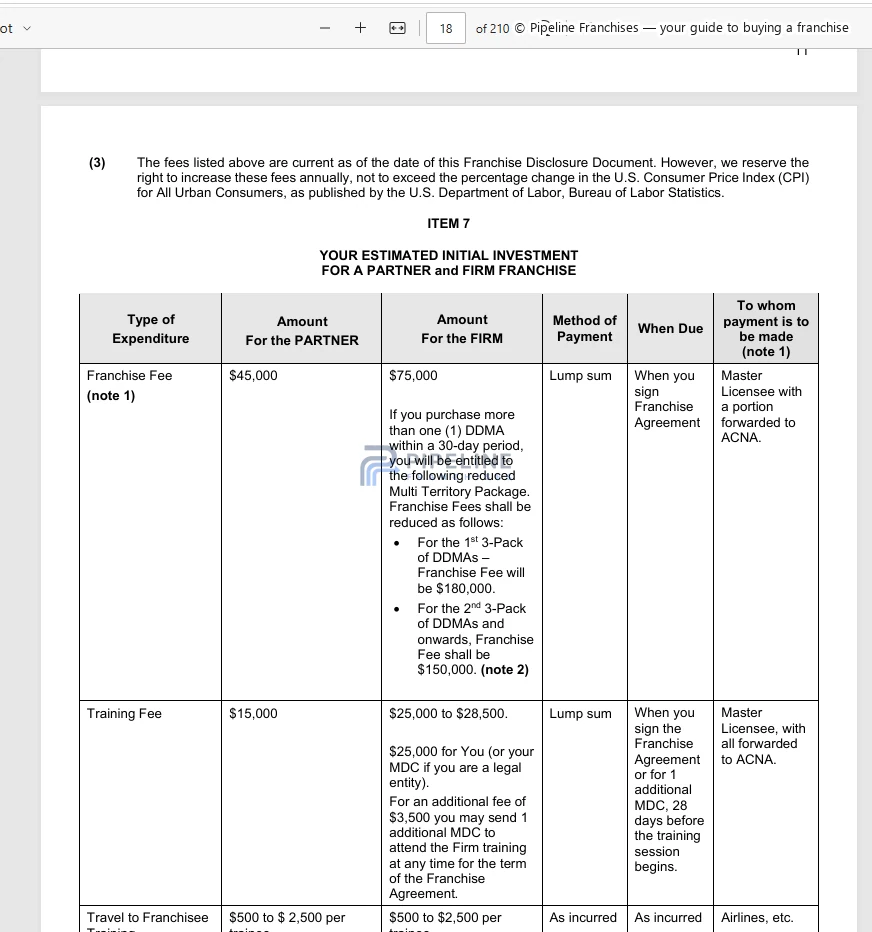
Initial investment: $71,668–$303,513 · Item 7 evidence below
Advantage +0.28 pts AAGK comprises apartment owners and managers, communities, and…Constraint -0.10 pts general operating-friction guardrail
Rank sensitivity: Moderately sensitive
Why it ranks here
Score-changing local relationships are grouped by factor. Each factor subtotal shows the net contribution after model controls.
Baseline70.00
Advantages+0.39 pts
Constraints-0.10 pts
Net local movement+0.288 pts
Final score70.29
3 material local relationships changed this score: 2 advantages and 1 constraint. 1 additional scored relationship fell below the public row threshold and reconcile to +0.034 pts.
Largest individual score driverAAGK comprises apartment owners and managers, communities, and vendors serving multifamily housing in Knox and surrounding counties. aAGK multifamily professional audience+0.28 pts
Factor
Referral ecosystem
Factor subtotal+0.28 pts
| Scored local driver | Effect | Evidence |
|---|
| AAGK comprises apartment owners and managers, communities, and vendors serving multifamily housing in Knox and surrounding counties. aAGK multifamily professional audienceLargest driverRelationship test: Rank stays #4 without this driver. | +0.28 pts | HighEvidence |
|---|
Factor
Regulatory and operating friction
Factor subtotal-0.10 pts
| Scored local driver | Effect | Evidence |
|---|
| general operating-friction guardrail | -0.10 pts | ModerateEvidence |
|---|
Factor
Target-market demand
Factor subtotal+0.11 pts
| Scored local driver | Effect | Evidence |
|---|
| 41.5% of housing units in structures with 2+ units multifamily housing share | +0.08 pts | ModerateEvidence |
|---|
Overall local score movement+0.288 ptsThis is the accounting total after all factor subtotals and model controls.
Potential candidate-specific adjustmentsThese relationships depend on territory, site, customer mix, project, or another candidate-specific selection. They stay outside the baseline city score until that selection is known; the model should then be rerun to produce the candidate-adjusted score.
Potential candidate constraintInstitutional procurement and vendor-onboarding frictionReferral ecosystem
Applicability depends on the selected procurement jurisdiction
Potential candidate constraintInstitutional procurement and vendor-onboarding frictionReferral ecosystem
Applicability depends on the selected procurement jurisdiction
Relationship effects are shown individually. Factor net values are secondary subtotals. Any scored relationship below the public materiality threshold is reconciled in the accounting residual.
Franchise evidence
Source material assessed
Item 3 — Litigation
1 imageItem 6 — Other Fees
1 imageItem 7 — Estimated Initial Investment
2 imagesItem 12 — Territory
1 imageItem 20 — Outlets and Franchise Information
1 imageFull calculation and evidence confidence
Audit layer
Full factor ledger
Full score ledger
Every factor is classified. Factor values here are net totals; the score-changing relationship table above preserves material positive and negative drivers even when they offset inside the same factor.
| Neutral model baseline | 70.00 |
|---|
| Target-market demand | +0.11 |
|---|
| Property replacement-cycle demand | Not included in the score |
|---|
| Competitive environment | Not included in the score |
|---|
| Labor and staffing friction | Not applicable to this operating model |
|---|
| Transportation, routing, and parking | Potential candidate-specific adjustment |
|---|
| Real estate and site feasibility | Not applicable to this operating model |
|---|
| Sales and customer acquisition | Not included in the score |
|---|
| Referral ecosystem | +0.28 |
|---|
| Territory quality | Not included in the score |
|---|
| Regulatory and operating friction | -0.10 |
|---|
| Full-precision calculated score | 70.288 |
|---|
| Published local-market alignment | 70.29 |
|---|
Factor calculations use full precision. Contributions and published scores are displayed to two decimal places; ranking order uses the full-precision score.
Evidence confidence
- City Modifier Evidence
- Strong
- Factor Research Coverage
- Limited
- Franchise-profile completeness
- Strong
- Source-evidence confidence
- Strong
- Geographic applicability
- Strong
- Overall evidence confidence
- Moderate evidence confidence
- Largest absolute effect
- Referral ecosystem +0.28 pts
- Tested rank range
- #3–#5
#5Tier 3 · Mixed modeled alignment70.03
Pillar To Post Home Inspectors
Home Inspection · transaction-linked mobile home-inspection service with executive multi-inspector ownership
Initial investment: $102,690–$134,290 · Item 7 evidence below
Advantage +0.65 pts 18.3% moved within the prior year recent-mover shareConstraint -1.12 pts 46.6% owner-occupied housing share
Rank sensitivity: Highly sensitive
Why it ranks here
Score-changing local relationships are grouped by factor. Each factor subtotal shows the net contribution after model controls.
Baseline70.00
Advantages+1.19 pts
Constraints-1.16 pts
Net local movement+0.031 pts
Final score70.03
5 material local relationships changed this score: 4 advantages and 1 constraint. 1 additional scored relationship fell below the public row threshold and reconcile to -0.041 pts.
Largest individual score driver46.6% owner-occupied housing share-1.12 pts
Factor
Target-market demand
Factor subtotal-0.41 pts
| Scored local driver | Effect | Evidence |
|---|
| 46.6% owner-occupied housing shareLargest driverRelationship test: Rank #5 to #1 without this driver. | -1.12 pts | HighEvidence |
|---|
| 18.3% moved within the prior year recent-mover share | +0.65 pts | HighEvidence |
|---|
| 397 permits building permits issued | +0.10 pts | ModerateEvidence |
|---|
Factor
Labor and staffing friction
Factor subtotal+0.29 pts
| Scored local driver | Effect | Evidence |
|---|
| $15.31/hour food preparation and serving mean hourly wage | +0.29 pts | HighEvidence |
|---|
Factor
Referral ecosystem
Factor subtotal+0.14 pts
| Scored local driver | Effect | Evidence |
|---|
| AAGK comprises apartment owners and managers, communities, and vendors serving multifamily housing in Knox and surrounding counties. aAGK multifamily professional audience | +0.14 pts | HighEvidence |
|---|
Overall local score movement+0.031 ptsThis is the accounting total after all factor subtotals and model controls.
Potential candidate-specific adjustmentsThese relationships depend on territory, site, customer mix, project, or another candidate-specific selection. They stay outside the baseline city score until that selection is known; the model should then be rerun to produce the candidate-adjusted score.
Potential candidate advantageReal-estate professional referral ecosystemReferral ecosystem
Applicability depends on the selected submarket
Relationship effects are shown individually. Factor net values are secondary subtotals. Any scored relationship below the public materiality threshold is reconciled in the accounting residual.
Franchise evidence
Source material assessed
Item 3 — Litigation
1 imageItem 6 — Other Fees
1 imageItem 7 — Estimated Initial Investment
2 imagesItem 12 — Territory
1 imageItem 19 — Financial Performance Representation
1 imageAdditional brand source material assessed
2 sourcesFull calculation and evidence confidence
Audit layer
Full factor ledger
Full score ledger
Every factor is classified. Factor values here are net totals; the score-changing relationship table above preserves material positive and negative drivers even when they offset inside the same factor.
| Neutral model baseline | 70.00 |
|---|
| Target-market demand | -0.41 |
|---|
| Property replacement-cycle demand | Not included in the score |
|---|
| Competitive environment | Not included in the score |
|---|
| Labor and staffing friction | +0.29 |
|---|
| Transportation, routing, and parking | Potential candidate-specific adjustment |
|---|
| Real estate and site feasibility | Not applicable to this operating model |
|---|
| Sales and customer acquisition | Not included in the score |
|---|
| Referral ecosystem | +0.14 |
|---|
| Territory quality | Not included in the score |
|---|
| Regulatory and operating friction | Not applicable to this operating model |
|---|
| Full-precision calculated score | 70.031 |
|---|
| Published local-market alignment | 70.03 |
|---|
Factor calculations use full precision. Contributions and published scores are displayed to two decimal places; ranking order uses the full-precision score.
Evidence confidence
- City Modifier Evidence
- Strong
- Factor Research Coverage
- Limited
- Franchise-profile completeness
- Strong
- Source-evidence confidence
- Strong
- Geographic applicability
- Strong
- Overall evidence confidence
- Moderate evidence confidence
- Largest absolute effect
- Target-market demand -0.41 pts
- Tested rank range
- #1–#6
#6Tier 3 · Mixed modeled alignment69.53
Rainbow International Restoration
Property Restoration · emergency property restoration and remediation
Initial investment: $185,336–$351,900 · Item 7 evidence below
Advantage +0.27 pts $15.31/hour food preparation and serving mean hourly wageConstraint -0.75 pts 46.6% owner-occupied housing share
Rank sensitivity: Moderately sensitive
Why it ranks here
Score-changing local relationships are grouped by factor. Each factor subtotal shows the net contribution after model controls.
Baseline70.00
Advantages+0.49 pts
Constraints-0.96 pts
Net local movement-0.468 pts
Final score69.53
4 material local relationships changed this score: 2 advantages and 2 constraints. 2 additional scored relationships fell below the public row threshold and reconcile to +0.090 pts.
Largest individual score driver46.6% owner-occupied housing share-0.75 pts
Factor
Target-market demand
Factor subtotal-0.53 pts
| Scored local driver | Effect | Evidence |
|---|
| 46.6% owner-occupied housing shareLargest driverRelationship test: Rank #6 to #4 without this driver. | -0.75 pts | HighEvidence |
|---|
| 53.4% renter-occupied housing share | +0.13 pts | HighEvidence |
|---|
Factor
Labor and staffing friction
Factor subtotal+0.27 pts
| Scored local driver | Effect | Evidence |
|---|
| $15.31/hour food preparation and serving mean hourly wage | +0.27 pts | HighEvidence |
|---|
Factor
Real estate and site feasibility
Factor subtotal-0.21 pts
| Scored local driver | Effect | Evidence |
|---|
| 1.9% industrial vacancy rate | -0.21 pts | ModerateEvidence |
|---|
Overall local score movement-0.468 ptsThis is the accounting total after all factor subtotals and model controls.
Potential candidate-specific adjustmentsThese relationships depend on territory, site, customer mix, project, or another candidate-specific selection. They stay outside the baseline city score until that selection is known; the model should then be rerun to produce the candidate-adjusted score.
Potential candidate advantageContractor and trade referral ecosystemReferral ecosystem
Applicability depends on the selected submarket
Potential candidate constraintCorridor or highway construction disruptionTransportation, routing, and parking
Applicability depends on the selected corridor
Potential candidate constraintInstitutional procurement and vendor-onboarding frictionReferral ecosystem
Applicability depends on the selected procurement jurisdiction
Potential candidate constraintInstitutional procurement and vendor-onboarding frictionReferral ecosystem
Applicability depends on the selected procurement jurisdiction
Relationship effects are shown individually. Factor net values are secondary subtotals. Any scored relationship below the public materiality threshold is reconciled in the accounting residual.
Franchise evidence
Source material assessed
Item 3 — Litigation
1 imageItem 6 — Other Fees
1 imageItem 7 — Estimated Initial Investment
2 imagesItem 12 — Territory
1 imageItem 20 — Outlets and Franchise Information
1 imageFull calculation and evidence confidence
Audit layer
Full factor ledger
Full score ledger
Every factor is classified. Factor values here are net totals; the score-changing relationship table above preserves material positive and negative drivers even when they offset inside the same factor.
| Neutral model baseline | 70.00 |
|---|
| Target-market demand | -0.53 |
|---|
| Property replacement-cycle demand | Not included in the score |
|---|
| Competitive environment | Not included in the score |
|---|
| Labor and staffing friction | +0.27 |
|---|
| Transportation, routing, and parking | Potential candidate-specific adjustment |
|---|
| Real estate and site feasibility | -0.21 |
|---|
| Sales and customer acquisition | Not included in the score |
|---|
| Referral ecosystem | Not applicable to this operating model |
|---|
| Territory quality | Not included in the score |
|---|
| Regulatory and operating friction | Not applicable to this operating model |
|---|
| Full-precision calculated score | 69.532 |
|---|
| Published local-market alignment | 69.53 |
|---|
Factor calculations use full precision. Contributions and published scores are displayed to two decimal places; ranking order uses the full-precision score.
Evidence confidence
- City Modifier Evidence
- Strong
- Factor Research Coverage
- Limited
- Franchise-profile completeness
- Strong
- Source-evidence confidence
- Strong
- Geographic applicability
- Strong
- Overall evidence confidence
- Moderate evidence confidence
- Largest absolute effect
- Target-market demand -0.53 pts
- Tested rank range
- #6–#8
#7Tier 3 · Mixed modeled alignment69.41
PuroClean
Property Restoration · mobile emergency property-restoration and remediation operator with insurance, property-manager and commercial-account…
Initial investment: $54,575–$262,145 · Item 7 evidence below
Advantage +0.27 pts $15.31/hour food preparation and serving mean hourly wageConstraint -0.75 pts 46.6% owner-occupied housing share
Rank sensitivity: Highly sensitive
Why it ranks here
Score-changing local relationships are grouped by factor. Each factor subtotal shows the net contribution after model controls.
Baseline70.00
Advantages+0.51 pts
Constraints-1.11 pts
Net local movement-0.594 pts
Final score69.41
5 material local relationships changed this score: 3 advantages and 2 constraints. 1 additional scored relationship fell below the public row threshold and reconcile to +0.044 pts.
Largest individual score driver46.6% owner-occupied housing share-0.75 pts
Factor
Target-market demand
Factor subtotal-0.51 pts
| Scored local driver | Effect | Evidence |
|---|
| 46.6% owner-occupied housing shareLargest driverRelationship test: Rank stays #7 without this driver. | -0.75 pts | HighEvidence |
|---|
| 53.4% renter-occupied housing share | +0.13 pts | HighEvidence |
|---|
| 41.5% of housing units in structures with 2+ units multifamily housing share | +0.06 pts | ModerateEvidence |
|---|
Factor
Real estate and site feasibility
Factor subtotal-0.36 pts
| Scored local driver | Effect | Evidence |
|---|
| 1.9% industrial vacancy rate | -0.36 pts | ModerateEvidence |
|---|
Factor
Labor and staffing friction
Factor subtotal+0.27 pts
| Scored local driver | Effect | Evidence |
|---|
| $15.31/hour food preparation and serving mean hourly wage | +0.27 pts | HighEvidence |
|---|
Overall local score movement-0.594 ptsThis is the accounting total after all factor subtotals and model controls.
Potential candidate-specific adjustmentsThese relationships depend on territory, site, customer mix, project, or another candidate-specific selection. They stay outside the baseline city score until that selection is known; the model should then be rerun to produce the candidate-adjusted score.
Potential candidate advantageContractor and trade referral ecosystemReferral ecosystem
Applicability depends on the selected submarket
Potential candidate constraintInstitutional procurement and vendor-onboarding frictionReferral ecosystem
Applicability depends on the selected procurement jurisdiction
Potential candidate constraintInstitutional procurement and vendor-onboarding frictionReferral ecosystem
Applicability depends on the selected procurement jurisdiction
Potential candidate constraintCorridor or highway construction disruptionTransportation, routing, and parking
Applicability depends on the selected corridor
Relationship effects are shown individually. Factor net values are secondary subtotals. Any scored relationship below the public materiality threshold is reconciled in the accounting residual.
Franchise evidence
Source material assessed
Item 3 — Litigation
1 imageItem 6 — Other Fees
1 imageItem 7 — Estimated Initial Investment
2 imagesItem 12 — Territory
1 imageItem 20 — Outlets and Franchise Information
1 imageFull calculation and evidence confidence
Audit layer
Full factor ledger
Full score ledger
Every factor is classified. Factor values here are net totals; the score-changing relationship table above preserves material positive and negative drivers even when they offset inside the same factor.
| Neutral model baseline | 70.00 |
|---|
| Target-market demand | -0.51 |
|---|
| Property replacement-cycle demand | Not included in the score |
|---|
| Competitive environment | Not included in the score |
|---|
| Labor and staffing friction | +0.27 |
|---|
| Transportation, routing, and parking | Potential candidate-specific adjustment |
|---|
| Real estate and site feasibility | -0.36 |
|---|
| Sales and customer acquisition | Not included in the score |
|---|
| Referral ecosystem | Not applicable to this operating model |
|---|
| Territory quality | Not included in the score |
|---|
| Regulatory and operating friction | Not applicable to this operating model |
|---|
| Full-precision calculated score | 69.406 |
|---|
| Published local-market alignment | 69.41 |
|---|
Factor calculations use full precision. Contributions and published scores are displayed to two decimal places; ranking order uses the full-precision score.
Evidence confidence
- City Modifier Evidence
- Strong
- Factor Research Coverage
- Limited
- Franchise-profile completeness
- Strong
- Source-evidence confidence
- Strong
- Geographic applicability
- Strong
- Overall evidence confidence
- Moderate evidence confidence
- Largest absolute effect
- Target-market demand -0.51 pts
- Tested rank range
- #6–#12
#8Tier 3 · Mixed modeled alignment69.36
Tiger Adjusters
Public Adjusting & Claims Advocacy · home-based regulated property-claims advocacy with field inspection and relationship-led acquisition
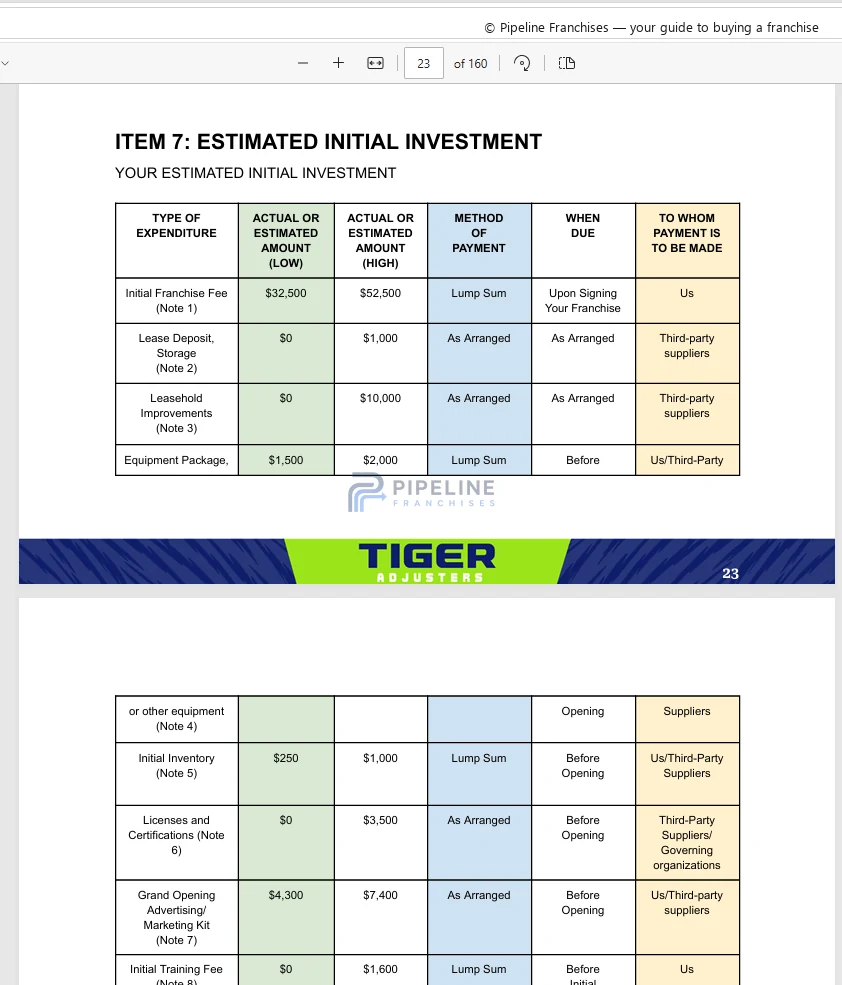
Initial investment: $43,050–$159,500 · Item 7 evidence below
Advantage +0.15 pts $15.31/hour food preparation and serving mean hourly wageConstraint -1.00 pts 46.6% owner-occupied housing share
Rank sensitivity: Moderately sensitive
Why it ranks here
Score-changing local relationships are grouped by factor. Each factor subtotal shows the net contribution after model controls.
Baseline70.00
Advantages+0.35 pts
Constraints-1.00 pts
Net local movement-0.642 pts
Final score69.36
4 material local relationships changed this score: 3 advantages and 1 constraint. 1 additional scored relationship fell below the public row threshold and reconcile to +0.042 pts.
Largest individual score driver46.6% owner-occupied housing share-1.00 pts
Factor
Target-market demand
Factor subtotal-0.84 pts
| Scored local driver | Effect | Evidence |
|---|
| 46.6% owner-occupied housing shareLargest driverRelationship test: Rank #8 to #5 without this driver. | -1.00 pts | HighEvidence |
|---|
| 53.4% renter-occupied housing share | +0.11 pts | HighEvidence |
|---|
Factor
Labor and staffing friction
Factor subtotal+0.15 pts
| Scored local driver | Effect | Evidence |
|---|
| $15.31/hour food preparation and serving mean hourly wage | +0.15 pts | HighEvidence |
|---|
Factor
Referral ecosystem
Factor subtotal+0.05 pts
| Scored local driver | Effect | Evidence |
|---|
| AAGK comprises apartment owners and managers, communities, and vendors serving multifamily housing in Knox and surrounding counties. aAGK multifamily professional audience | +0.05 pts | HighEvidence |
|---|
Overall local score movement-0.642 ptsThis is the accounting total after all factor subtotals and model controls.
Potential candidate-specific adjustmentsThese relationships depend on territory, site, customer mix, project, or another candidate-specific selection. They stay outside the baseline city score until that selection is known; the model should then be rerun to produce the candidate-adjusted score.
Potential candidate advantageContractor and trade referral ecosystemReferral ecosystem
Applicability depends on the selected submarket
Relationship effects are shown individually. Factor net values are secondary subtotals. Any scored relationship below the public materiality threshold is reconciled in the accounting residual.
Franchise evidence
Source material assessed
Item 3 — Litigation
1 imageItem 6 — Other Fees
1 imageItem 7 — Estimated Initial Investment
2 imagesItem 12 — Territory
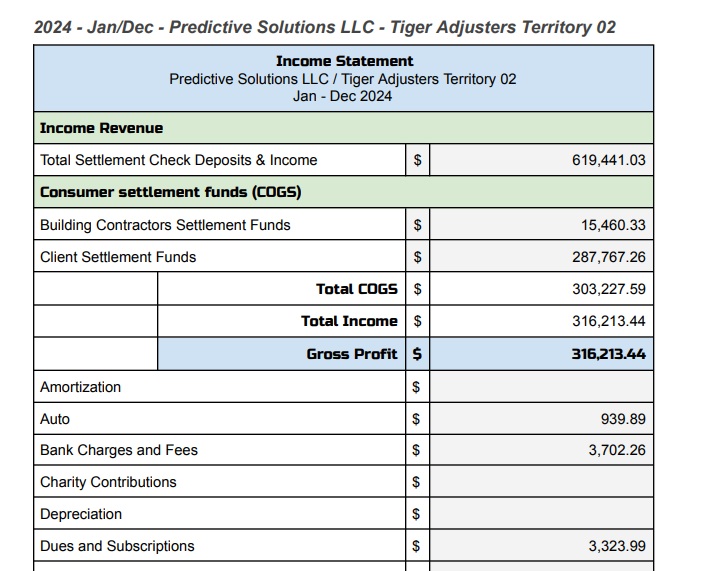
1 imageItem 19 — Financial Performance Representation
1 imageAdditional brand source material assessed
1 sourceFull calculation and evidence confidence
Audit layer
Full factor ledger
Full score ledger
Every factor is classified. Factor values here are net totals; the score-changing relationship table above preserves material positive and negative drivers even when they offset inside the same factor.
| Neutral model baseline | 70.00 |
|---|
| Target-market demand | -0.84 |
|---|
| Property replacement-cycle demand | Not included in the score |
|---|
| Competitive environment | Not included in the score |
|---|
| Labor and staffing friction | +0.15 |
|---|
| Transportation, routing, and parking | Potential candidate-specific adjustment |
|---|
| Real estate and site feasibility | Not applicable to this operating model |
|---|
| Sales and customer acquisition | Not included in the score |
|---|
| Referral ecosystem | +0.05 |
|---|
| Territory quality | Not included in the score |
|---|
| Regulatory and operating friction | Not applicable to this operating model |
|---|
| Full-precision calculated score | 69.358 |
|---|
| Published local-market alignment | 69.36 |
|---|
Factor calculations use full precision. Contributions and published scores are displayed to two decimal places; ranking order uses the full-precision score.
Evidence confidence
- City Modifier Evidence
- Strong
- Factor Research Coverage
- Limited
- Franchise-profile completeness
- Strong
- Source-evidence confidence
- Strong
- Geographic applicability
- Strong
- Overall evidence confidence
- Moderate evidence confidence
- Largest absolute effect
- Target-market demand -0.84 pts
- Tested rank range
- #7–#9
#9Tier 3 · Mixed modeled alignment69.13
Workout Anytime
Full-Service Fitness · fixed location value priced recurring membership fitness club
Initial investment: $1,060,850–$1,840,550 · Item 7 evidence below
Advantage +0.41 pts 22.2% ages 20-29 young-adult share age 20-29Constraint -0.94 pts All work that disturbs or changes land requires a City of Knoxville…
Rank sensitivity: Highly sensitive
Why it ranks here
Score-changing local relationships are grouped by factor. Each factor subtotal shows the net contribution after model controls.
Baseline70.00
Advantages+0.60 pts
Constraints-1.47 pts
Net local movement-0.873 pts
Final score69.13
6 material local relationships changed this score: 2 advantages and 4 constraints. 2 additional scored relationships fell below the public row threshold.
Largest individual score driverAll work that disturbs or changes land requires a City of Knoxville site development permit. site-development permit required for land disturbance-0.94 pts
Factor
Regulatory and operating friction
Factor subtotal-1.27 pts
| Scored local driver | Effect | Evidence |
|---|
| All work that disturbs or changes land requires a City of Knoxville site development permit. site-development permit required for land disturbanceLargest driverRelationship test: Rank #9 to #5 without this driver. | -0.94 pts | HighEvidence |
|---|
| KUB lists a $3,600 standard tap fee for a 2-inch water meter. kUB 2-inch standard water tap fee | -0.23 pts | HighEvidence |
|---|
| KUB requires all new or renovated food-service facilities to install and maintain grease-control equipment; KUB determines equipment type and size. kUB grease-control equipment requirement for new or renovated food-service facilities | -0.07 pts | HighEvidence |
|---|
Factor
Target-market demand
Factor subtotal+0.25 pts
| Scored local driver | Effect | Evidence |
|---|
| 22.2% ages 20-29 young-adult share age 20-29 | +0.41 pts | HighEvidence |
|---|
| $54,039 median household income | -0.20 pts | HighEvidence |
|---|
Factor
Labor and staffing friction
Factor subtotal+0.15 pts
| Scored local driver | Effect | Evidence |
|---|
| $15.31/hour food preparation and serving mean hourly wage | +0.15 pts | HighEvidence |
|---|
Overall local score movement-0.873 ptsThis is the accounting total after all factor subtotals and model controls.
Potential candidate-specific adjustmentsThese relationships depend on territory, site, customer mix, project, or another candidate-specific selection. They stay outside the baseline city score until that selection is known; the model should then be rerun to produce the candidate-adjusted score.
Potential candidate constraintWetland, runoff and stormwater mitigation requirementsRegulatory and operating friction
Applicability depends on the selected site specific
Potential candidate constraintHistoric-district or design-review requirementsRegulatory and operating friction
Applicability depends on the selected district
Relationship effects are shown individually. Factor net values are secondary subtotals. Any scored relationship below the public materiality threshold is reconciled in the accounting residual.
Franchise evidence
Source material assessed
Item 3 — Litigation
1 imageItem 6 — Other Fees
1 imageItem 7 — Estimated Initial Investment
2 imagesItem 12 — Territory
1 imageItem 20 — Outlets and Franchise Information
1 imageFull calculation and evidence confidence
Audit layer
Full factor ledger
Full score ledger
Every factor is classified. Factor values here are net totals; the score-changing relationship table above preserves material positive and negative drivers even when they offset inside the same factor.
| Neutral model baseline | 70.00 |
|---|
| Target-market demand | +0.25 |
|---|
| Property replacement-cycle demand | Not included in the score |
|---|
| Competitive environment | Not included in the score |
|---|
| Labor and staffing friction | +0.15 |
|---|
| Transportation, routing, and parking | Potential candidate-specific adjustment |
|---|
| Real estate and site feasibility | Not applicable to this operating model |
|---|
| Sales and customer acquisition | Not included in the score |
|---|
| Referral ecosystem | Not applicable to this operating model |
|---|
| Territory quality | Not included in the score |
|---|
| Regulatory and operating friction | -1.27 |
|---|
| Full-precision calculated score | 69.127 |
|---|
| Published local-market alignment | 69.13 |
|---|
Factor calculations use full precision. Contributions and published scores are displayed to two decimal places; ranking order uses the full-precision score.
Evidence confidence
- City Modifier Evidence
- Strong
- Factor Research Coverage
- Limited
- Franchise-profile completeness
- Strong
- Source-evidence confidence
- Strong
- Geographic applicability
- Strong
- Overall evidence confidence
- Moderate evidence confidence
- Largest absolute effect
- Regulatory and operating friction -1.27 pts
- Tested rank range
- #4–#14
#10Tier 3 · Mixed modeled alignment68.94
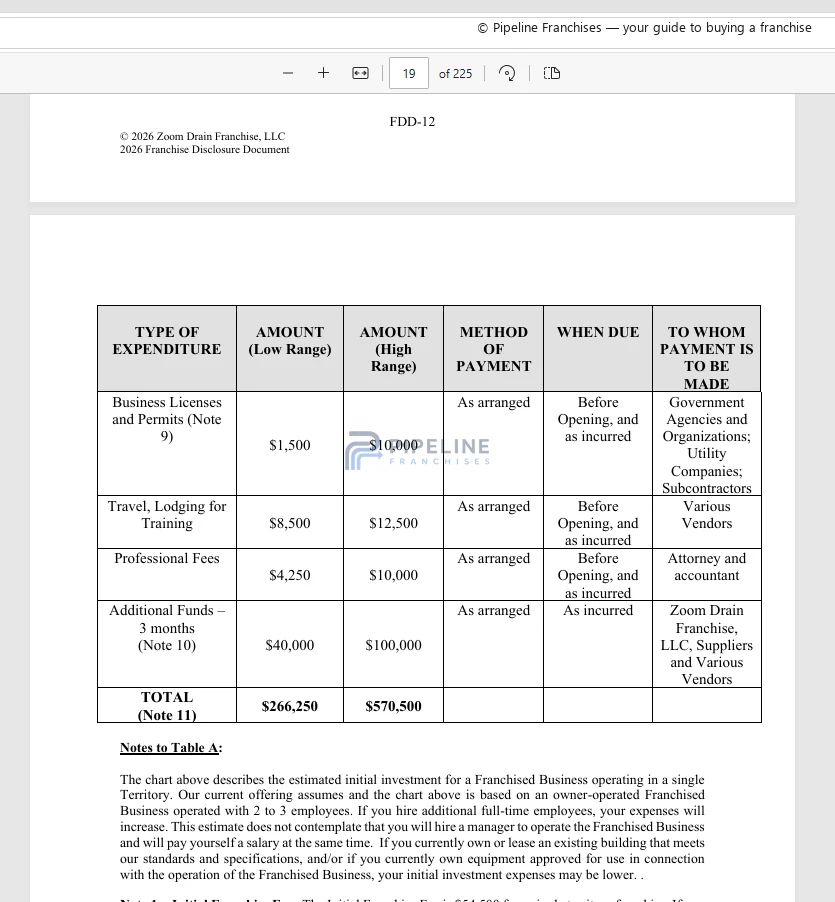
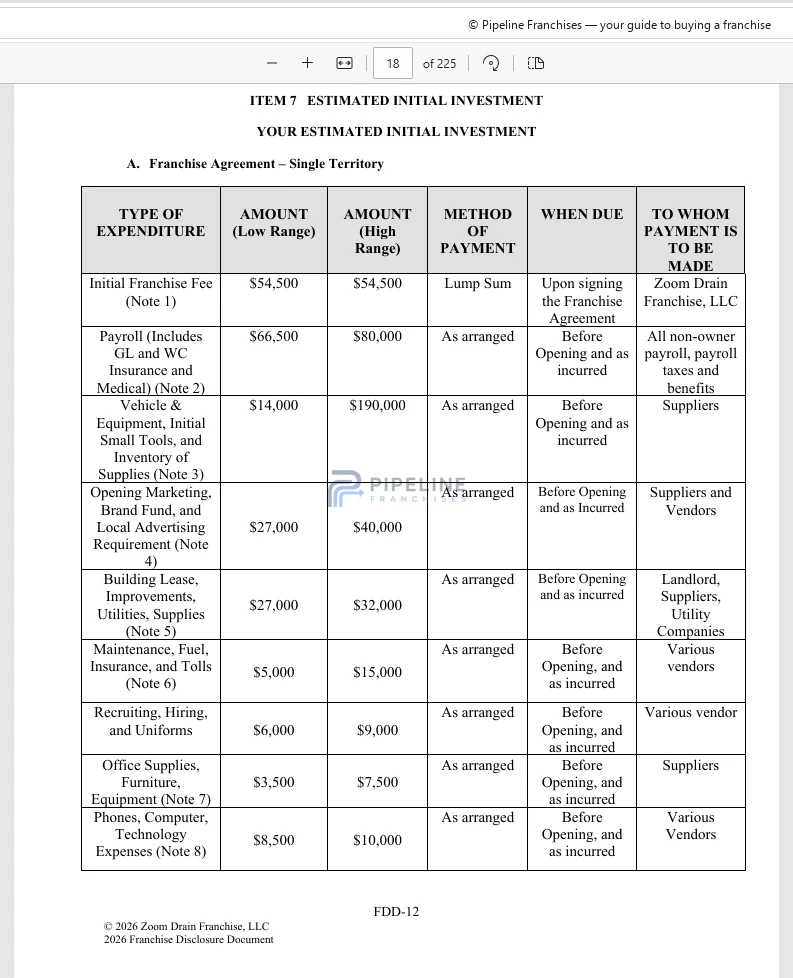
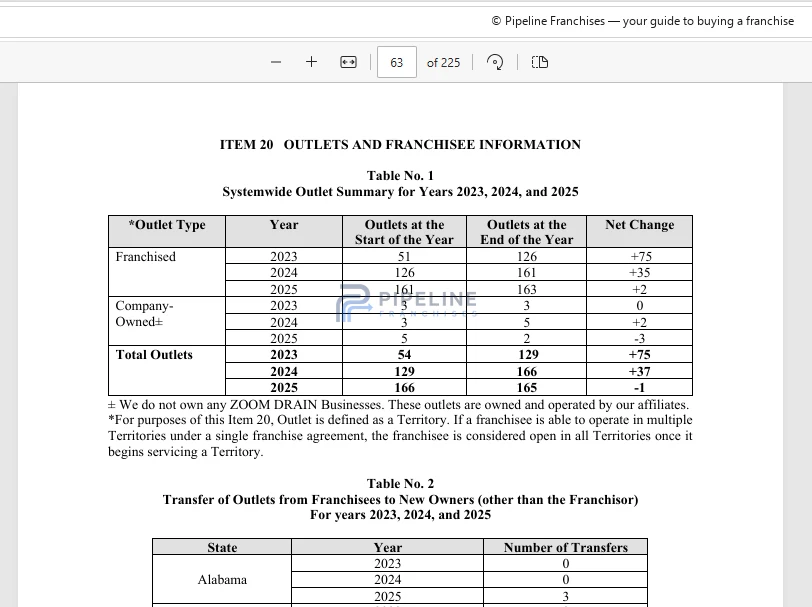
ZOOM DRAIN
Plumbing & Drain Services · mobile drain and sewer specialist
Initial investment: $266,250–$570,500 · Item 7 evidence below
Advantage +0.40 pts $15.31/hour food preparation and serving mean hourly wageConstraint -1.12 pts 46.6% owner-occupied housing share
Rank sensitivity: Highly sensitive
Why it ranks here
Score-changing local relationships are grouped by factor. Each factor subtotal shows the net contribution after model controls.
Baseline70.00
Advantages+0.60 pts
Constraints-1.66 pts
Net local movement-1.060 pts
Final score68.94
6 material local relationships changed this score: 3 advantages and 3 constraints. 3 additional scored relationships fell below the public row threshold and reconcile to +0.023 pts.
Largest individual score driver46.6% owner-occupied housing share-1.12 pts
Factor
Target-market demand
Factor subtotal-1.20 pts
| Scored local driver | Effect | Evidence |
|---|
| 46.6% owner-occupied housing shareLargest driverRelationship test: Rank #10 to #9 without this driver. | -1.12 pts | HighEvidence |
|---|
| 52.1% of occupied housing units detached single-family housing share | -0.24 pts | HighEvidence |
|---|
| 53.4% renter-occupied housing share | +0.07 pts | HighEvidence |
|---|
| 41.5% of housing units in structures with 2+ units multifamily housing share | +0.06 pts | ModerateEvidence |
|---|
Factor
Labor and staffing friction
Factor subtotal+0.40 pts
| Scored local driver | Effect | Evidence |
|---|
| $15.31/hour food preparation and serving mean hourly wage | +0.40 pts | HighEvidence |
|---|
Factor
Real estate and site feasibility
Factor subtotal-0.26 pts
| Scored local driver | Effect | Evidence |
|---|
| 1.9% industrial vacancy rate | -0.26 pts | ModerateEvidence |
|---|
Overall local score movement-1.060 ptsThis is the accounting total after all factor subtotals and model controls.
Potential candidate-specific adjustmentsThese relationships depend on territory, site, customer mix, project, or another candidate-specific selection. They stay outside the baseline city score until that selection is known; the model should then be rerun to produce the candidate-adjusted score.
Potential candidate advantageContractor and trade referral ecosystemReferral ecosystem
Applicability depends on the selected submarket
Potential candidate constraintCorridor or highway construction disruptionTransportation, routing, and parking
Applicability depends on the selected corridor
Relationship effects are shown individually. Factor net values are secondary subtotals. Any scored relationship below the public materiality threshold is reconciled in the accounting residual.
Franchise evidence
Source material assessed
Item 3 — Litigation
1 imageItem 6 — Other Fees
1 imageItem 7 — Estimated Initial Investment
2 imagesItem 12 — Territory
1 imageItem 20 — Outlets and Franchise Information
1 imageFull calculation and evidence confidence
Audit layer
Full factor ledger
Full score ledger
Every factor is classified. Factor values here are net totals; the score-changing relationship table above preserves material positive and negative drivers even when they offset inside the same factor.
| Neutral model baseline | 70.00 |
|---|
| Target-market demand | -1.20 |
|---|
| Property replacement-cycle demand | Not included in the score |
|---|
| Competitive environment | Not included in the score |
|---|
| Labor and staffing friction | +0.40 |
|---|
| Transportation, routing, and parking | Potential candidate-specific adjustment |
|---|
| Real estate and site feasibility | -0.26 |
|---|
| Sales and customer acquisition | Not included in the score |
|---|
| Referral ecosystem | Not applicable to this operating model |
|---|
| Territory quality | Not included in the score |
|---|
| Regulatory and operating friction | Not applicable to this operating model |
|---|
| Full-precision calculated score | 68.940 |
|---|
| Published local-market alignment | 68.94 |
|---|
Factor calculations use full precision. Contributions and published scores are displayed to two decimal places; ranking order uses the full-precision score.
Evidence confidence
- City Modifier Evidence
- Strong
- Factor Research Coverage
- Limited
- Franchise-profile completeness
- Strong
- Source-evidence confidence
- Strong
- Geographic applicability
- Strong
- Overall evidence confidence
- Moderate evidence confidence
- Largest absolute effect
- Target-market demand -1.20 pts
- Tested rank range
- #6–#10
#11Tier 3 · Mixed modeled alignment68.80
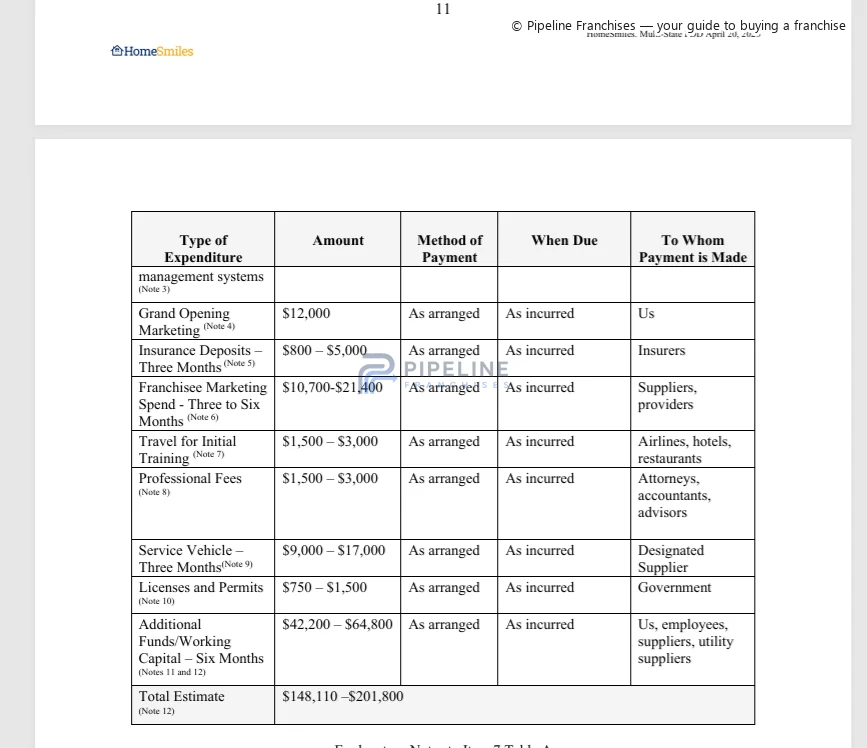
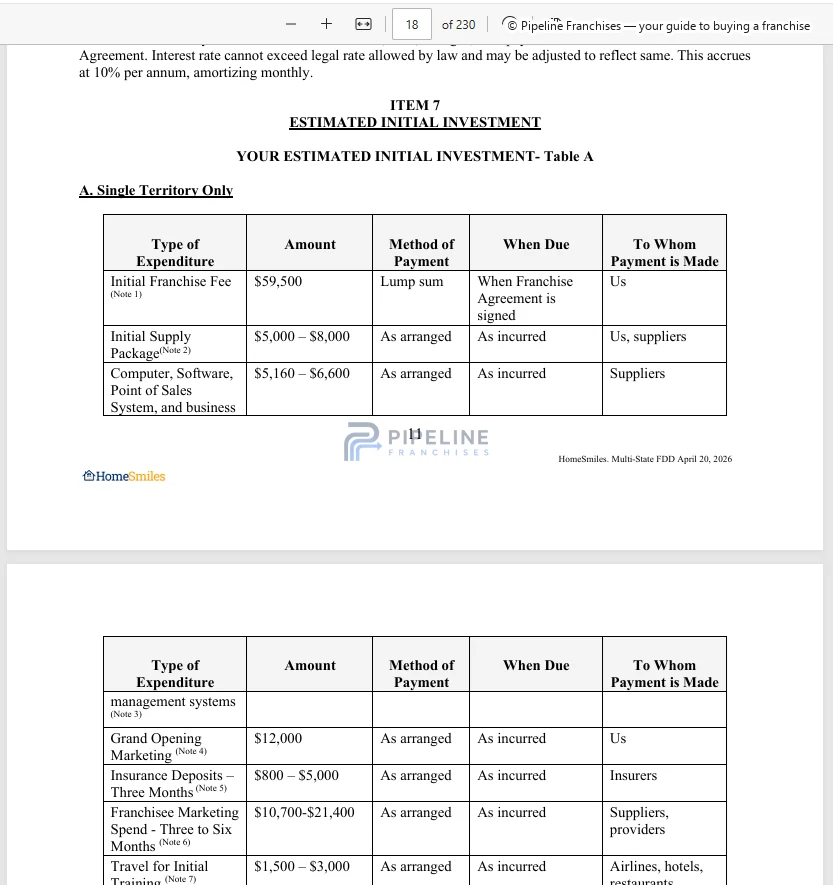
HomeSmiles
Recurring Property Maintenance · mobile recurring multi-service property maintenance
Initial investment: $148,110–$201,800 · Item 7 evidence below
Advantage +0.32 pts $15.31/hour food preparation and serving mean hourly wageConstraint -1.24 pts 46.6% owner-occupied housing share
Rank sensitivity: Highly sensitive
Why it ranks here
Score-changing local relationships are grouped by factor. Each factor subtotal shows the net contribution after model controls.
Baseline70.00
Advantages+0.51 pts
Constraints-1.71 pts
Net local movement-1.199 pts
Final score68.80
7 material local relationships changed this score: 4 advantages and 3 constraints.
Largest individual score driver46.6% owner-occupied housing share-1.24 pts
Factor
Target-market demand
Factor subtotal-1.52 pts
| Scored local driver | Effect | Evidence |
|---|
| 46.6% owner-occupied housing shareLargest driverRelationship test: Rank #11 to #12 without this driver. | -1.24 pts | HighEvidence |
|---|
| 52.1% of occupied housing units detached single-family housing share | -0.40 pts | HighEvidence |
|---|
| 41.5% of housing units in structures with 2+ units multifamily housing share | +0.07 pts | ModerateEvidence |
|---|
| 53.4% renter-occupied housing share | +0.07 pts | HighEvidence |
|---|
| $54,039 median household income | -0.07 pts | HighEvidence |
|---|
| 3,630,410 passengers mcGhee Tyson Airport annual passengers | +0.06 pts | ModerateEvidence |
|---|
Factor
Labor and staffing friction
Factor subtotal+0.32 pts
| Scored local driver | Effect | Evidence |
|---|
| $15.31/hour food preparation and serving mean hourly wage | +0.32 pts | HighEvidence |
|---|
Overall local score movement-1.199 ptsThis is the accounting total after all factor subtotals and model controls.
Relationship effects are shown individually. Factor net values are secondary subtotals. Any scored relationship below the public materiality threshold is reconciled in the accounting residual.
Franchise evidence
Source material assessed
Item 3 — Litigation
1 imageItem 6 — Other Fees
1 imageItem 7 — Estimated Initial Investment
2 imagesItem 12 — Territory
1 imageItem 20 — Outlets and Franchise Information
1 imageFull calculation and evidence confidence
Audit layer
Full factor ledger
Full score ledger
Every factor is classified. Factor values here are net totals; the score-changing relationship table above preserves material positive and negative drivers even when they offset inside the same factor.
| Neutral model baseline | 70.00 |
|---|
| Target-market demand | -1.52 |
|---|
| Property replacement-cycle demand | Not included in the score |
|---|
| Competitive environment | Not included in the score |
|---|
| Labor and staffing friction | +0.32 |
|---|
| Transportation, routing, and parking | Potential candidate-specific adjustment |
|---|
| Real estate and site feasibility | Not applicable to this operating model |
|---|
| Sales and customer acquisition | Not included in the score |
|---|
| Referral ecosystem | Not applicable to this operating model |
|---|
| Territory quality | Not included in the score |
|---|
| Regulatory and operating friction | Not applicable to this operating model |
|---|
| Full-precision calculated score | 68.801 |
|---|
| Published local-market alignment | 68.80 |
|---|
Factor calculations use full precision. Contributions and published scores are displayed to two decimal places; ranking order uses the full-precision score.
Evidence confidence
- City Modifier Evidence
- Strong
- Factor Research Coverage
- Limited
- Franchise-profile completeness
- Strong
- Source-evidence confidence
- Strong
- Geographic applicability
- Strong
- Overall evidence confidence
- Moderate evidence confidence
- Largest absolute effect
- Target-market demand -1.52 pts
- Tested rank range
- #2–#13
#12Tier 3 · Mixed modeled alignment68.79
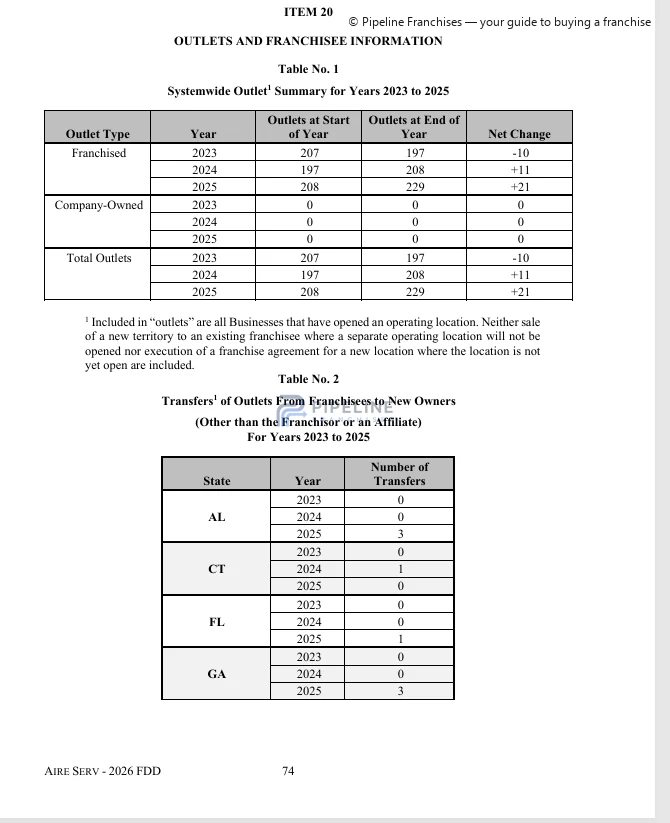
Aire Serv
HVAC · mobile hvac field service with required service base
Initial investment: $113,308–$271,708 · Item 7 evidence below
Advantage +0.41 pts $15.31/hour food preparation and serving mean hourly wageConstraint -1.12 pts 46.6% owner-occupied housing share
Rank sensitivity: Moderately sensitive
Why it ranks here
Score-changing local relationships are grouped by factor. Each factor subtotal shows the net contribution after model controls.
Baseline70.00
Advantages+0.56 pts
Constraints-1.77 pts
Net local movement-1.208 pts
Final score68.79
5 material local relationships changed this score: 2 advantages and 3 constraints. 3 additional scored relationships fell below the public row threshold and reconcile to +0.053 pts.
Largest individual score driver46.6% owner-occupied housing share-1.12 pts
Factor
Target-market demand
Factor subtotal-1.25 pts
| Scored local driver | Effect | Evidence |
|---|
| 46.6% owner-occupied housing shareLargest driverRelationship test: Rank #12 to #11 without this driver. | -1.12 pts | HighEvidence |
|---|
| 52.1% of occupied housing units detached single-family housing share | -0.24 pts | HighEvidence |
|---|
| 397 permits building permits issued | +0.06 pts | ModerateEvidence |
|---|
Factor
Labor and staffing friction
Factor subtotal+0.41 pts
| Scored local driver | Effect | Evidence |
|---|
| $15.31/hour food preparation and serving mean hourly wage | +0.41 pts | HighEvidence |
|---|
Factor
Real estate and site feasibility
Factor subtotal-0.36 pts
| Scored local driver | Effect | Evidence |
|---|
| 1.9% industrial vacancy rate | -0.36 pts | ModerateEvidence |
|---|
Overall local score movement-1.208 ptsThis is the accounting total after all factor subtotals and model controls.
Relationship effects are shown individually. Factor net values are secondary subtotals. Any scored relationship below the public materiality threshold is reconciled in the accounting residual.
Franchise evidence
Source material assessed
Item 3 — Litigation
1 imageItem 6 — Other Fees
1 imageItem 7 — Estimated Initial Investment
1 imageItem 12 — Territory
1 imageItem 20 — Outlets and Franchise Information
1 imageItem 19 — Financial Performance Representation
1 imageAdditional brand source material assessed
1 sourceFull calculation and evidence confidence
Audit layer
Full factor ledger
Full score ledger
Every factor is classified. Factor values here are net totals; the score-changing relationship table above preserves material positive and negative drivers even when they offset inside the same factor.
| Neutral model baseline | 70.00 |
|---|
| Target-market demand | -1.25 |
|---|
| Property replacement-cycle demand | Not included in the score |
|---|
| Competitive environment | Not included in the score |
|---|
| Labor and staffing friction | +0.41 |
|---|
| Transportation, routing, and parking | Potential candidate-specific adjustment |
|---|
| Real estate and site feasibility | -0.36 |
|---|
| Sales and customer acquisition | Not included in the score |
|---|
| Referral ecosystem | Not applicable to this operating model |
|---|
| Territory quality | Not included in the score |
|---|
| Regulatory and operating friction | Not applicable to this operating model |
|---|
| Full-precision calculated score | 68.792 |
|---|
| Published local-market alignment | 68.79 |
|---|
Factor calculations use full precision. Contributions and published scores are displayed to two decimal places; ranking order uses the full-precision score.
Evidence confidence
- City Modifier Evidence
- Strong
- Factor Research Coverage
- Limited
- Franchise-profile completeness
- Strong
- Source-evidence confidence
- Strong
- Geographic applicability
- Strong
- Overall evidence confidence
- Moderate evidence confidence
- Largest absolute effect
- Target-market demand -1.25 pts
- Tested rank range
- #9–#12
#13Tier 3 · Mixed modeled alignment68.73
Mr. Rooter
Plumbing & Drain Services · mobile plumbing and drain service business
Initial investment: $152,900–$298,675 · Item 7 evidence below
Advantage +0.40 pts $15.31/hour food preparation and serving mean hourly wageConstraint -1.12 pts 46.6% owner-occupied housing share
Rank sensitivity: Highly sensitive
Why it ranks here
Score-changing local relationships are grouped by factor. Each factor subtotal shows the net contribution after model controls.
Baseline70.00
Advantages+0.57 pts
Constraints-1.84 pts
Net local movement-1.275 pts
Final score68.73
4 material local relationships changed this score: 1 advantage and 3 constraints. 5 additional scored relationships fell below the public row threshold and reconcile to +0.152 pts.
Largest individual score driver46.6% owner-occupied housing share-1.12 pts
Factor
Target-market demand
Factor subtotal-1.21 pts
| Scored local driver | Effect | Evidence |
|---|
| 46.6% owner-occupied housing shareLargest driverRelationship test: Rank stays #13 without this driver. | -1.12 pts | HighEvidence |
|---|
| 52.1% of occupied housing units detached single-family housing share | -0.24 pts | HighEvidence |
|---|
Factor
Real estate and site feasibility
Factor subtotal-0.47 pts
| Scored local driver | Effect | Evidence |
|---|
| 1.9% industrial vacancy rate | -0.47 pts | ModerateEvidence |
|---|
Factor
Labor and staffing friction
Factor subtotal+0.40 pts
| Scored local driver | Effect | Evidence |
|---|
| $15.31/hour food preparation and serving mean hourly wage | +0.40 pts | HighEvidence |
|---|
Overall local score movement-1.275 ptsThis is the accounting total after all factor subtotals and model controls.
Potential candidate-specific adjustmentsThese relationships depend on territory, site, customer mix, project, or another candidate-specific selection. They stay outside the baseline city score until that selection is known; the model should then be rerun to produce the candidate-adjusted score.
Potential candidate constraintCorridor or highway construction disruptionTransportation, routing, and parking
Applicability depends on the selected corridor
Relationship effects are shown individually. Factor net values are secondary subtotals. Any scored relationship below the public materiality threshold is reconciled in the accounting residual.
Franchise evidence
Source material assessed
Item 3 — Litigation
1 imageItem 6 — Other Fees
1 imageItem 7 — Estimated Initial Investment
2 imagesItem 12 — Territory
1 imageItem 20 — Outlets and Franchise Information
1 imageFull calculation and evidence confidence
Audit layer
Full factor ledger
Full score ledger
Every factor is classified. Factor values here are net totals; the score-changing relationship table above preserves material positive and negative drivers even when they offset inside the same factor.
| Neutral model baseline | 70.00 |
|---|
| Target-market demand | -1.21 |
|---|
| Property replacement-cycle demand | Not included in the score |
|---|
| Competitive environment | Not included in the score |
|---|
| Labor and staffing friction | +0.40 |
|---|
| Transportation, routing, and parking | Potential candidate-specific adjustment |
|---|
| Real estate and site feasibility | -0.47 |
|---|
| Sales and customer acquisition | Not included in the score |
|---|
| Referral ecosystem | Not applicable to this operating model |
|---|
| Territory quality | Not included in the score |
|---|
| Regulatory and operating friction | Not applicable to this operating model |
|---|
| Full-precision calculated score | 68.725 |
|---|
| Published local-market alignment | 68.73 |
|---|
Factor calculations use full precision. Contributions and published scores are displayed to two decimal places; ranking order uses the full-precision score.
Evidence confidence
- City Modifier Evidence
- Strong
- Factor Research Coverage
- Limited
- Franchise-profile completeness
- Strong
- Source-evidence confidence
- Strong
- Geographic applicability
- Strong
- Overall evidence confidence
- Moderate evidence confidence
- Largest absolute effect
- Target-market demand -1.21 pts
- Tested rank range
- #9–#13
#14Tier 3 · Mixed modeled alignment68.61
Mister Sparky Electric
Electrical Services · mobile residential electrical service
Advantage +0.34 pts $15.31/hour food preparation and serving mean hourly wageConstraint -1.37 pts 46.6% owner-occupied housing share
Rank sensitivity: Highly sensitive
Why it ranks here
Score-changing local relationships are grouped by factor. Each factor subtotal shows the net contribution after model controls.
Baseline70.00
Advantages+0.37 pts
Constraints-1.76 pts
Net local movement-1.387 pts
Final score68.61
4 material local relationships changed this score: 1 advantage and 3 constraints. 2 additional scored relationships fell below the public row threshold and reconcile to -0.013 pts.
Largest individual score driver46.6% owner-occupied housing share-1.37 pts
Factor
Target-market demand
Factor subtotal-1.59 pts
| Scored local driver | Effect | Evidence |
|---|
| 46.6% owner-occupied housing shareLargest driverRelationship test: Rank #14 to #10 without this driver. | -1.37 pts | HighEvidence |
|---|
| 52.1% of occupied housing units detached single-family housing share | -0.20 pts | HighEvidence |
|---|
Factor
Labor and staffing friction
Factor subtotal+0.34 pts
| Scored local driver | Effect | Evidence |
|---|
| $15.31/hour food preparation and serving mean hourly wage | +0.34 pts | HighEvidence |
|---|
Factor
Real estate and site feasibility
Factor subtotal-0.14 pts
| Scored local driver | Effect | Evidence |
|---|
| 1.9% industrial vacancy rate | -0.14 pts | ModerateEvidence |
|---|
Overall local score movement-1.387 ptsThis is the accounting total after all factor subtotals and model controls.
Potential candidate-specific adjustmentsThese relationships depend on territory, site, customer mix, project, or another candidate-specific selection. They stay outside the baseline city score until that selection is known; the model should then be rerun to produce the candidate-adjusted score.
Potential candidate constraintCorridor or highway construction disruptionTransportation, routing, and parking
Applicability depends on the selected corridor
Relationship effects are shown individually. Factor net values are secondary subtotals. Any scored relationship below the public materiality threshold is reconciled in the accounting residual.
Full calculation and evidence confidence
Audit layer
Full factor ledger
Full score ledger
Every factor is classified. Factor values here are net totals; the score-changing relationship table above preserves material positive and negative drivers even when they offset inside the same factor.
| Neutral model baseline | 70.00 |
|---|
| Target-market demand | -1.59 |
|---|
| Property replacement-cycle demand | Not included in the score |
|---|
| Competitive environment | Not included in the score |
|---|
| Labor and staffing friction | +0.34 |
|---|
| Transportation, routing, and parking | Potential candidate-specific adjustment |
|---|
| Real estate and site feasibility | -0.14 |
|---|
| Sales and customer acquisition | Not included in the score |
|---|
| Referral ecosystem | Not applicable to this operating model |
|---|
| Territory quality | Not included in the score |
|---|
| Regulatory and operating friction | Not applicable to this operating model |
|---|
| Full-precision calculated score | 68.613 |
|---|
| Published local-market alignment | 68.61 |
|---|
Factor calculations use full precision. Contributions and published scores are displayed to two decimal places; ranking order uses the full-precision score.
Evidence confidence
- City Modifier Evidence
- Strong
- Factor Research Coverage
- Limited
- Franchise-profile completeness
- Strong
- Source-evidence confidence
- Strong
- Geographic applicability
- Strong
- Overall evidence confidence
- Moderate evidence confidence
- Largest absolute effect
- Target-market demand -1.59 pts
- Tested rank range
- #4–#14
No franchise concepts match the selected filters.