Most impactful relationship #1
Local condition410,053Population growth since 2020
Operating exposureBroad population and household growth
8 of 14 concepts affected57% of concepts assessed
HomeSmilesMister Sparky ElectricAire ServMr. Rooter+4

Local operating-model alignment analysis
Compare 14 franchise concepts in Aurora and see how 410,053 residents in 2025; +6.2% from the 2020 estimates base population growth since 2020 shaped...
Bottom line
We compared 14 franchise concepts against Aurora's local operating conditions. Aurora's 410,053 residents in 2025; +6.2% from the 2020 estimates base population growth since 2020 created one of the strongest positive local signals for concepts exposed to broad population and household growth. [1] [2] The $21.46/hour vs $17.86 U.S. mean wage for food preparation and serving occupations across Denver-Aurora-Centennial, Colorado metropolitan statistical area created one of the more important local constraints for concepts exposed to high local occupational wage cost environment. [6]
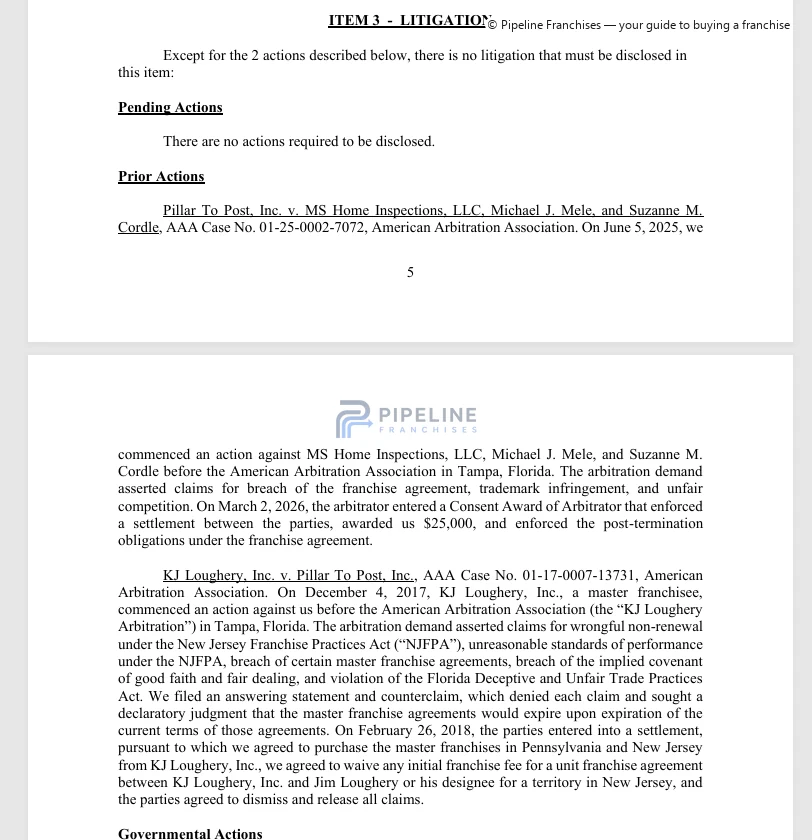
Pillar To Post Home Inspectors scored 71.00. It leads Mr. Rooter by 0.28 points. The documented moved since previous year in Aurora is 15.6% moved since the previous year. For Pillar To Post Home Inspectors, this was the largest positive contribution, adding 0.90 points through high housing turnover and occupancy change. [3] 62.4% owner-occupied of housing in Aurora is owner occupied. For Pillar To Post Home Inspectors, this was the largest negative contribution, reducing the score by 0.33 points through low homeownership concentration. [1] [2] The largest direct difference versus Mr. Rooter came from Aurora's 15.6% moved since the previous year moved since previous year, which contributed +0.90 points to Pillar To Post Home Inspectors versus 0.00 points to Mr. Rooter. [3]
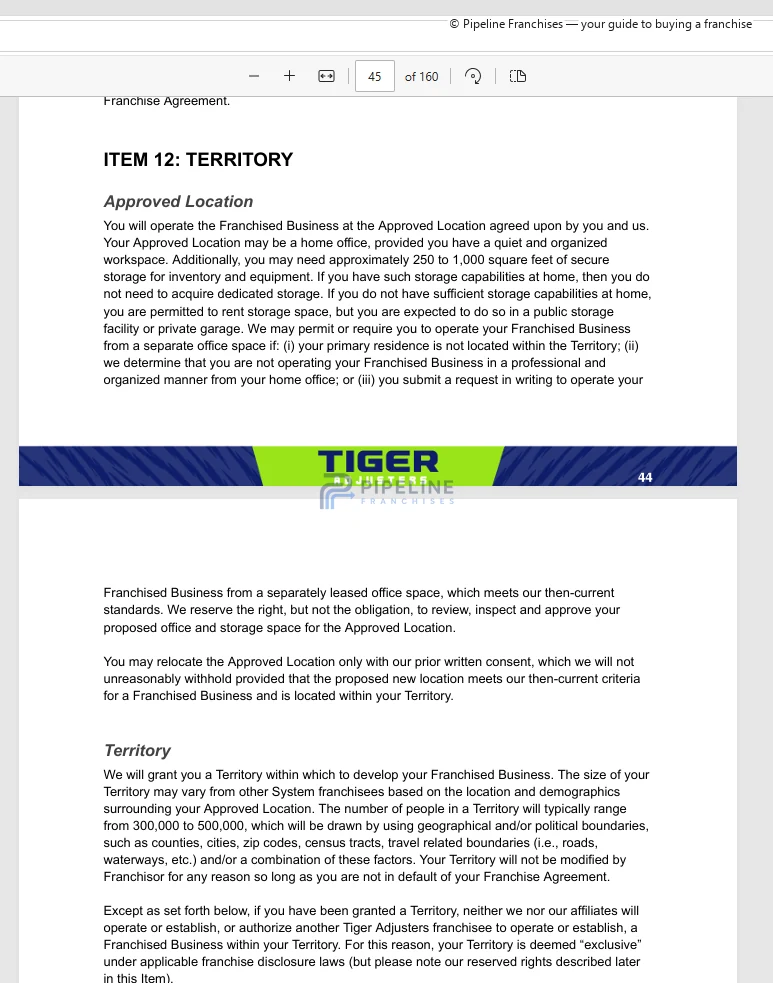
What this means: this is a deterministic comparison of documented local conditions against resolved operating-model exposures. It is not an earnings forecast, investment recommendation, or franchise-quality rating.
Best franchise opportunities assessed
“Best” refers to modeled local operating alignment among the concepts assessed—not expected earnings, franchise-system quality, or candidate fit.
| Rank | Franchise | Alignment and tier | Largest advantage | Largest constraint | Evidence confidence |
|---|---|---|---|---|---|
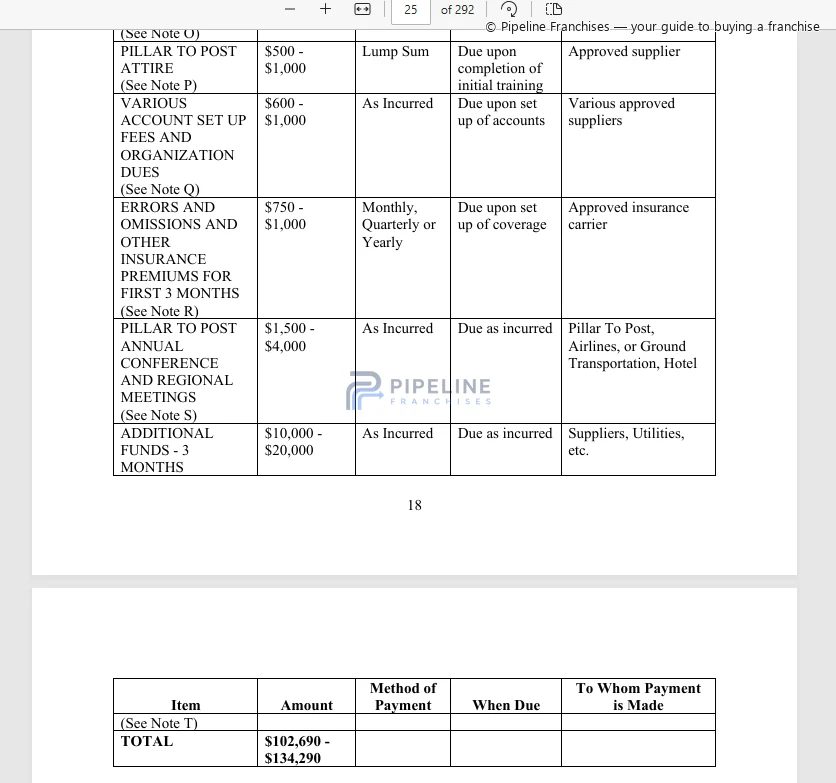
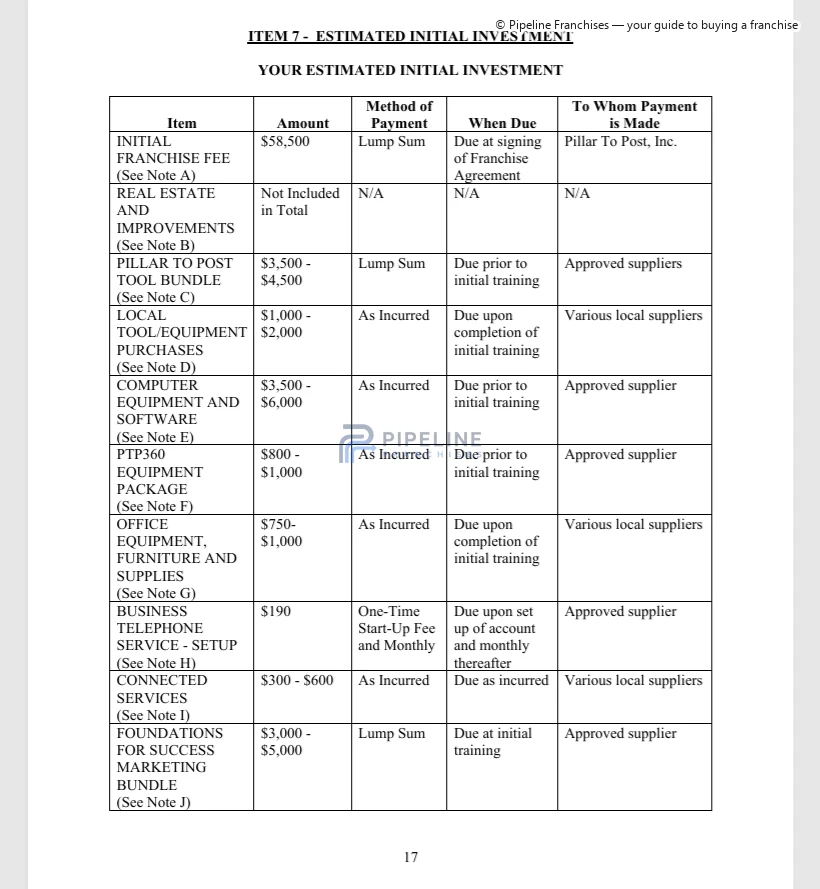
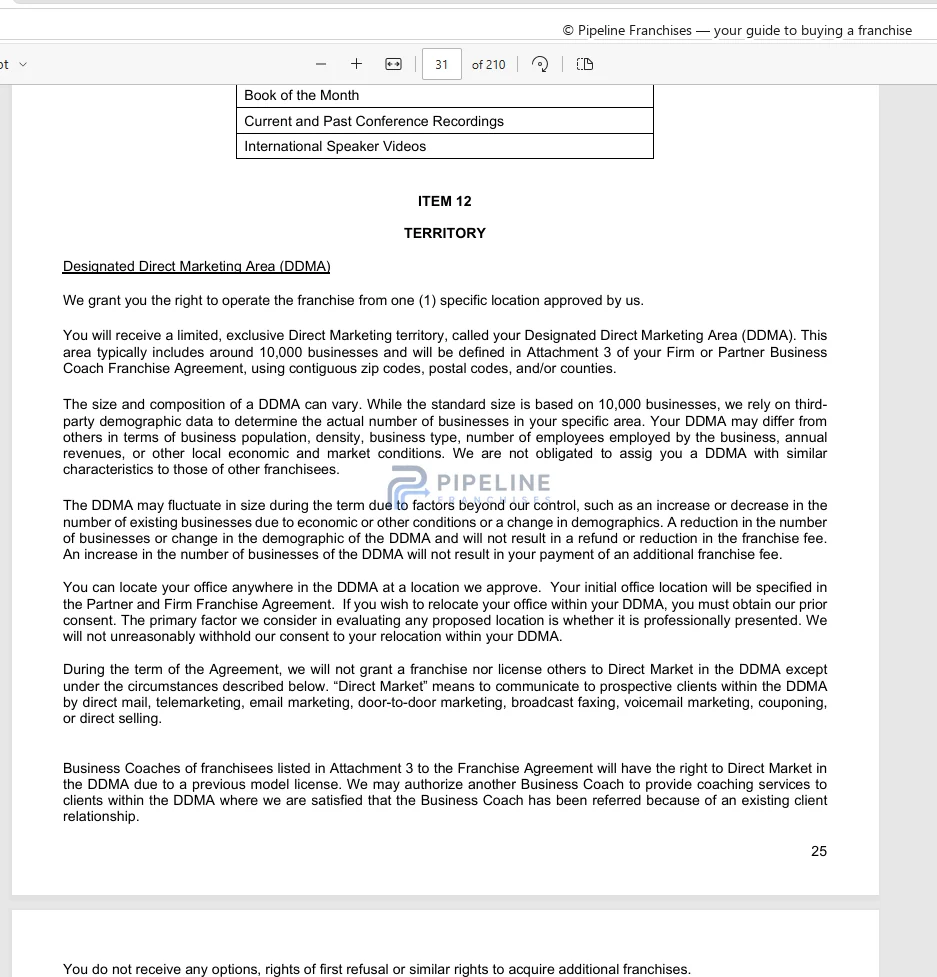
| 1 | Pillar To Post Home InspectorsHome InspectionInvestment: $102,690–$134,290 Item 7 source | 71.00Tier 3 · Mixed modeled alignment | +0.90 pts15.6% moved since the previous year moved since previous year | -0.33 pts62.4% owner-occupied owner-occupied housing share | High evidence confidence |
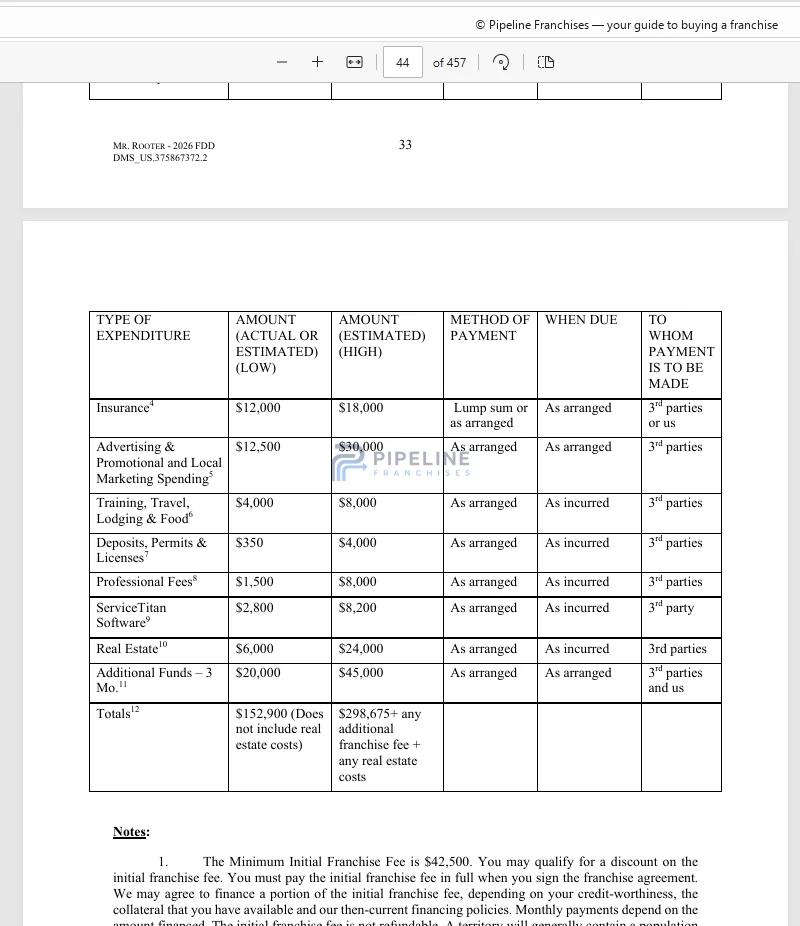
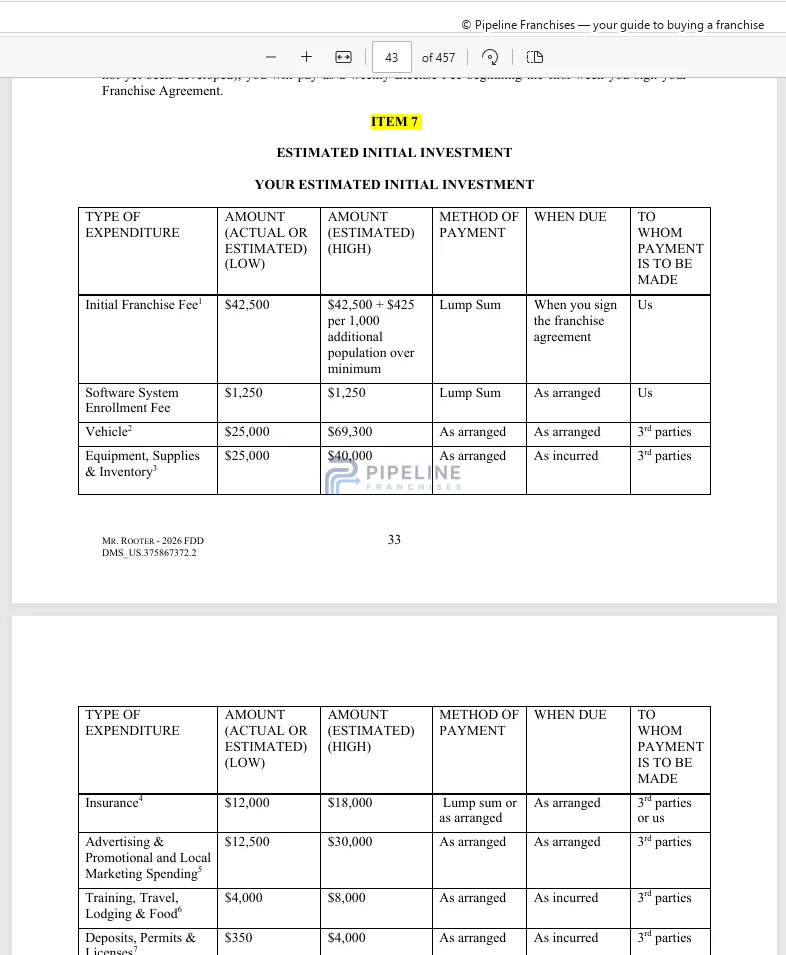
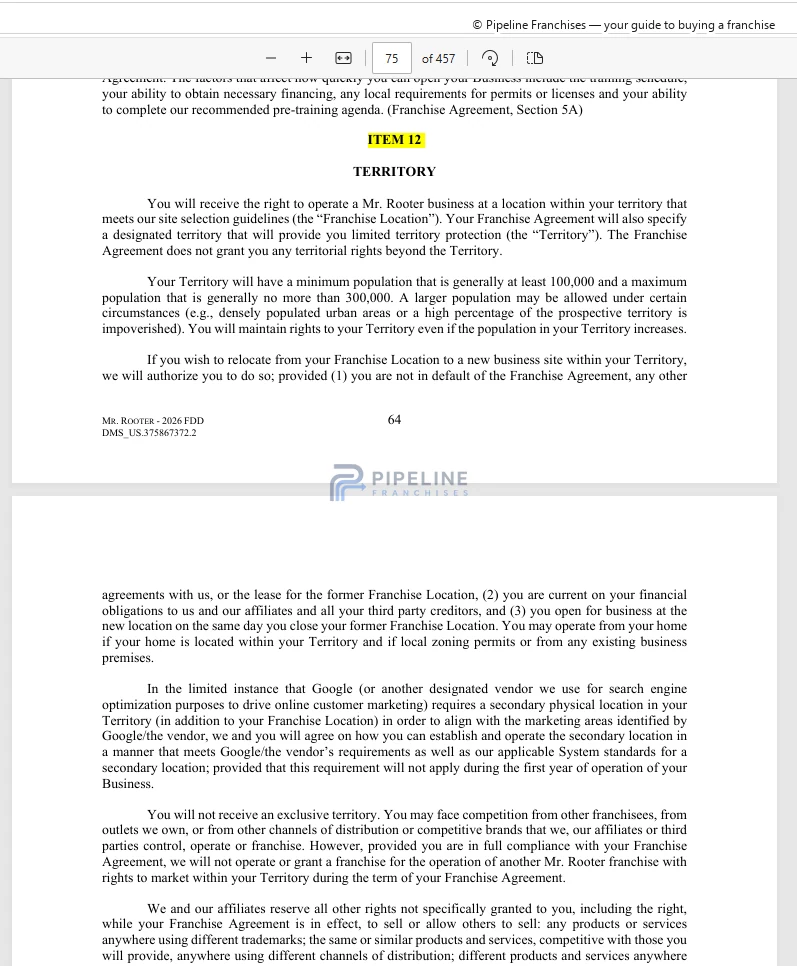
| 2 | Mr. RooterPlumbing & Drain ServicesInvestment: $152,900–$298,675 Item 7 source | 70.72Tier 3 · Mixed modeled alignment | +0.79 ptsAverage hardness 136 mg/L as CaCO3 (range 87-198), within the USGS… | -0.40 pts$21.46/hour vs $17.86 U.S | High evidence confidence |
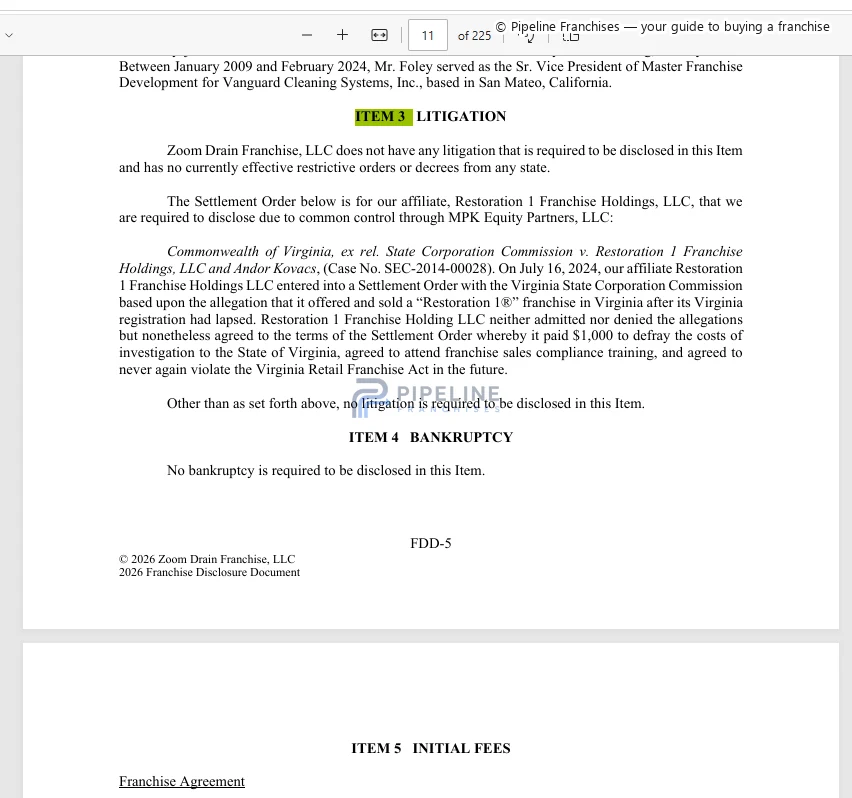
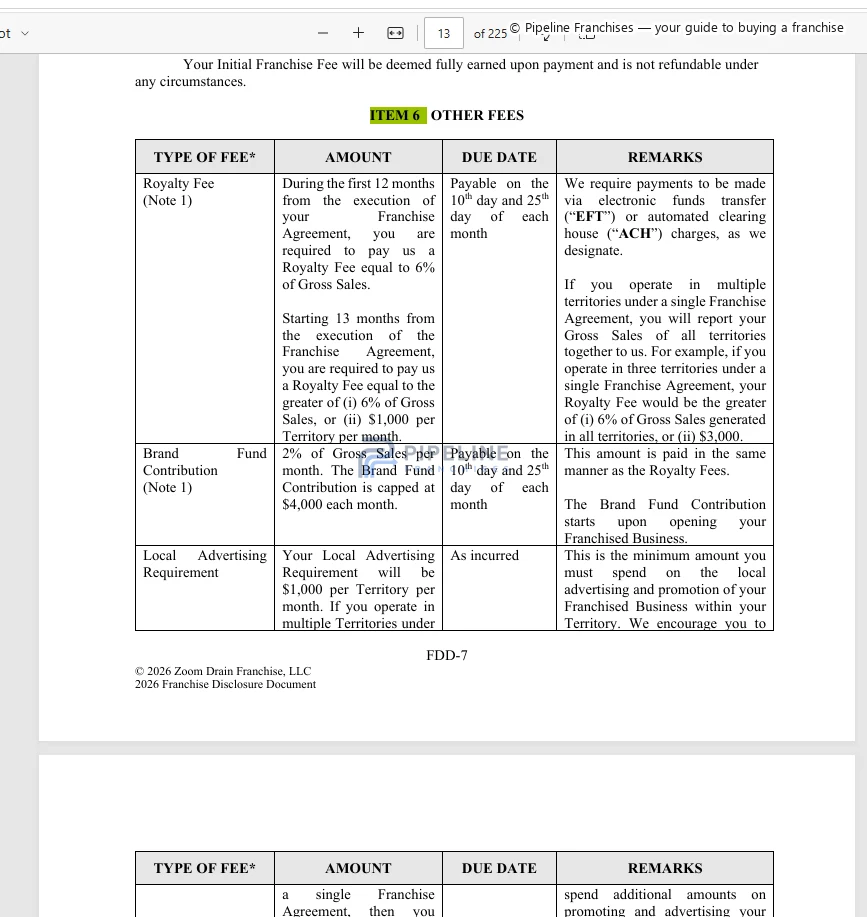
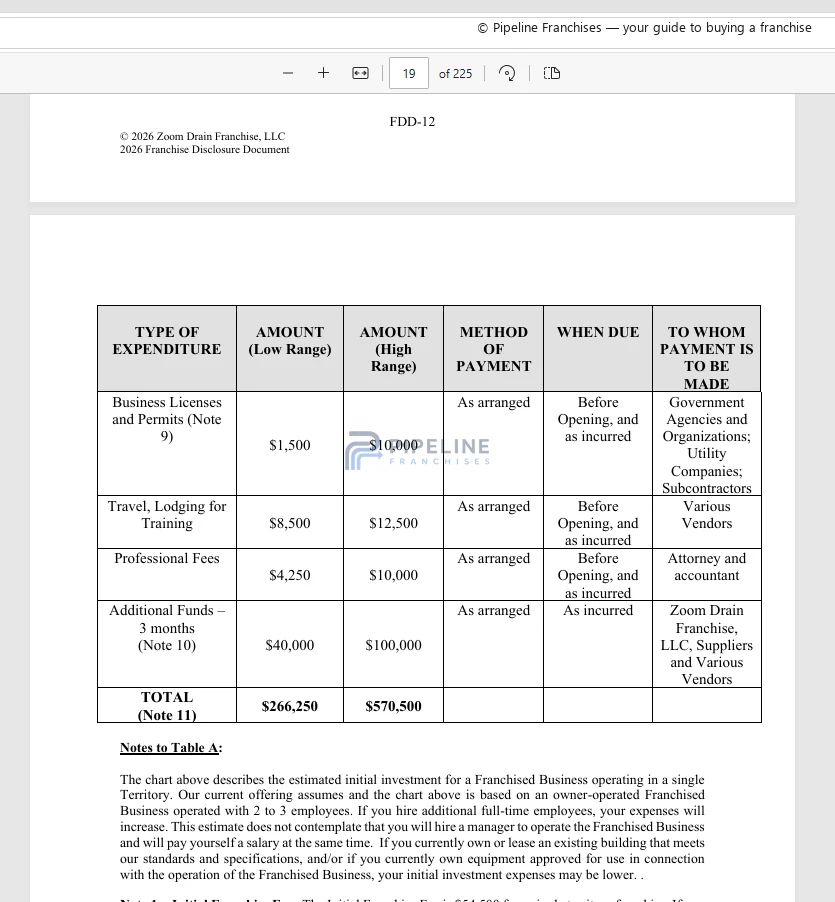
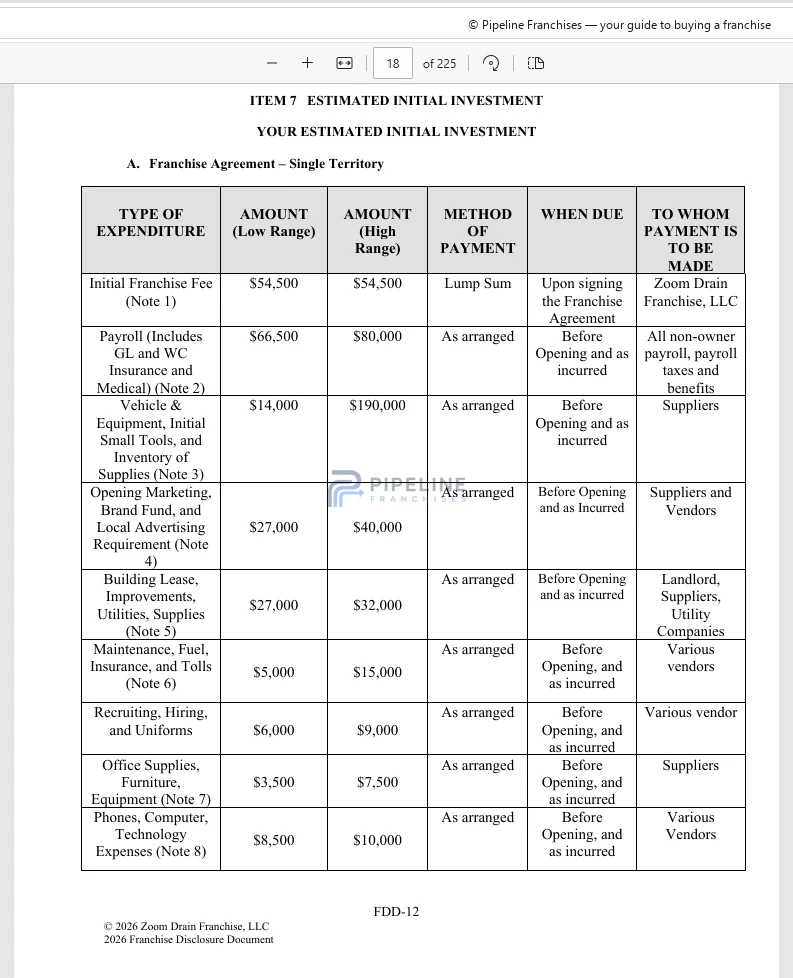
| 3 | ZOOM DRAINPlumbing & Drain ServicesInvestment: $266,250–$570,500 Item 7 source | 70.62Tier 3 · Mixed modeled alignment | +0.79 ptsAverage hardness 136 mg/L as CaCO3 (range 87-198), within the USGS… | -0.40 pts$21.46/hour vs $17.86 U.S | High evidence confidence |
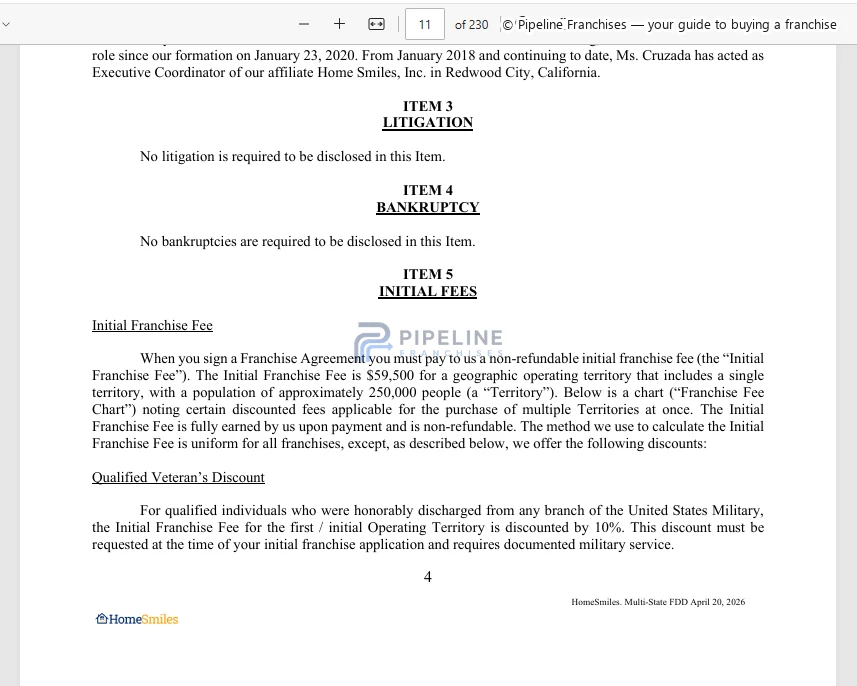
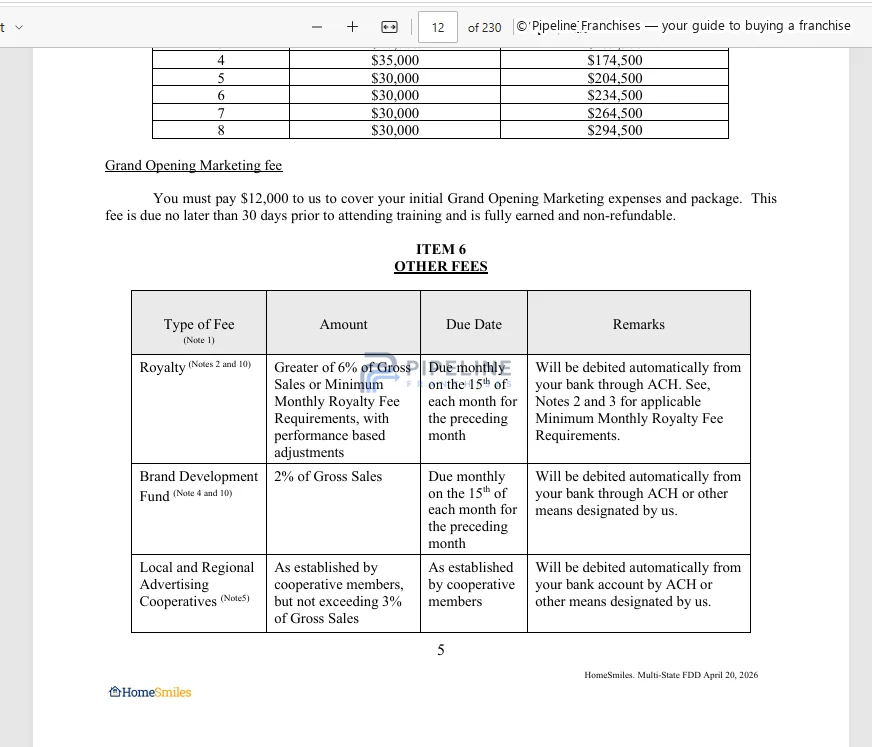
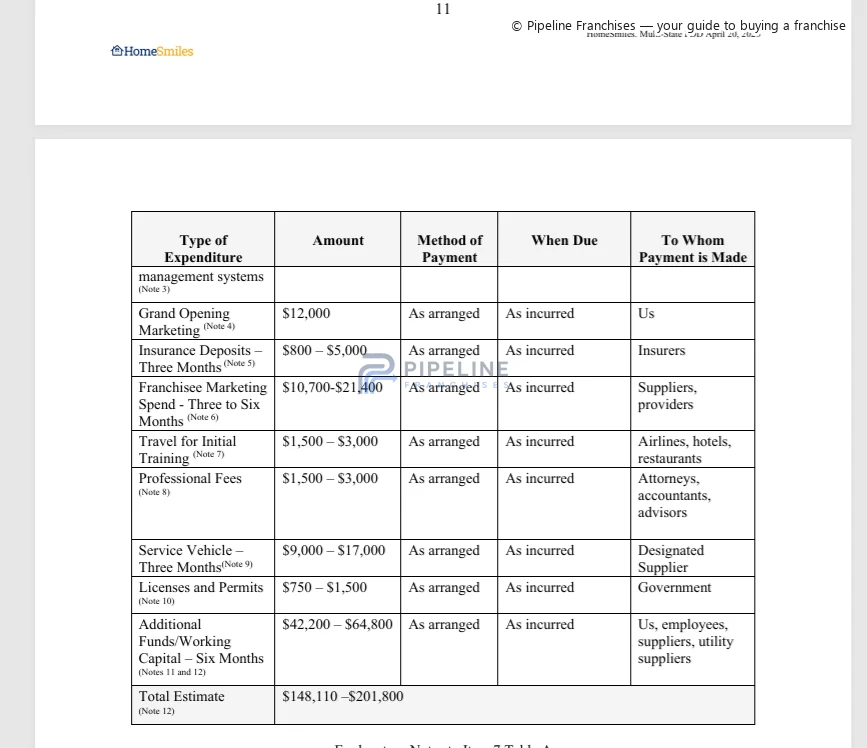
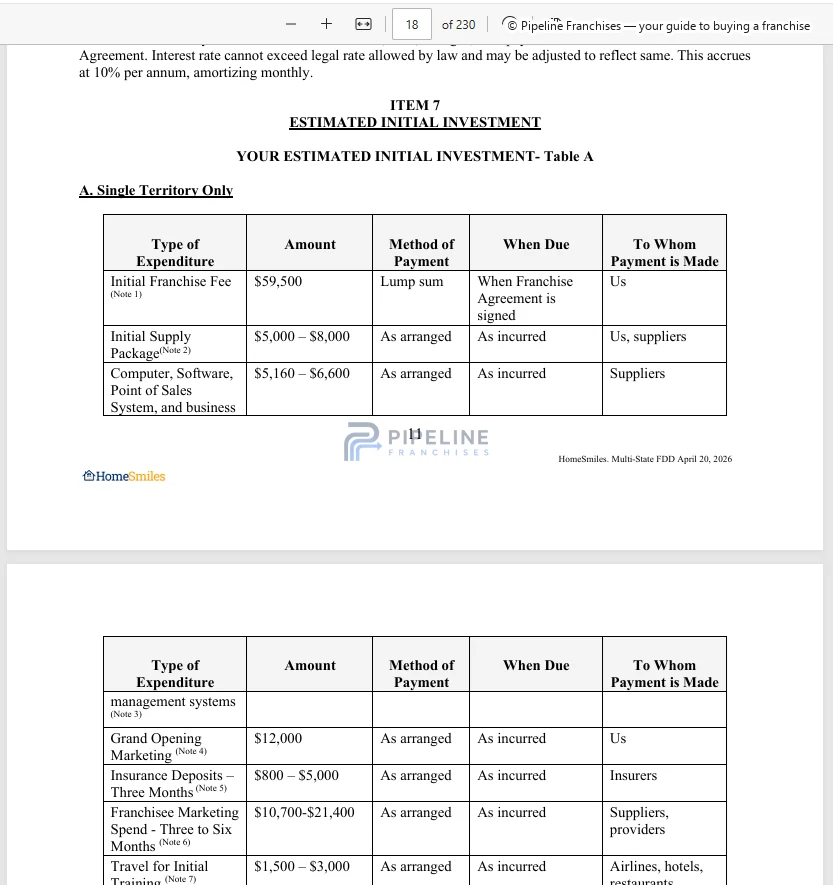
| 4 | HomeSmilesRecurring Property MaintenanceInvestment: $148,110–$201,800 Item 7 source | 70.26Tier 3 · Mixed modeled alignment | +0.85 pts410,053 residents in 2025; +6.2% from the 2020 estimates base… | -0.37 pts62.4% owner-occupied owner-occupied housing share | High evidence confidence |
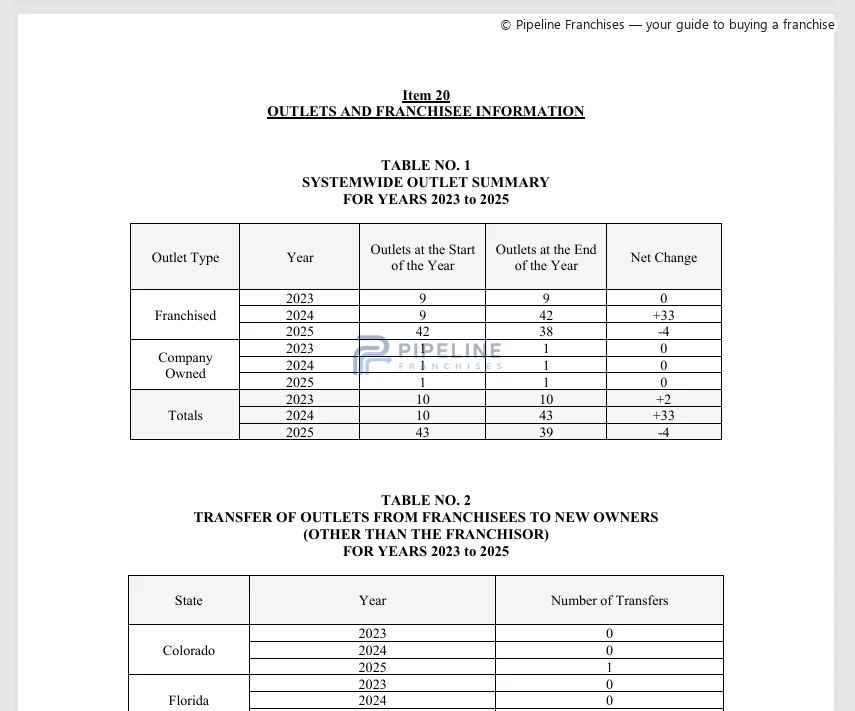
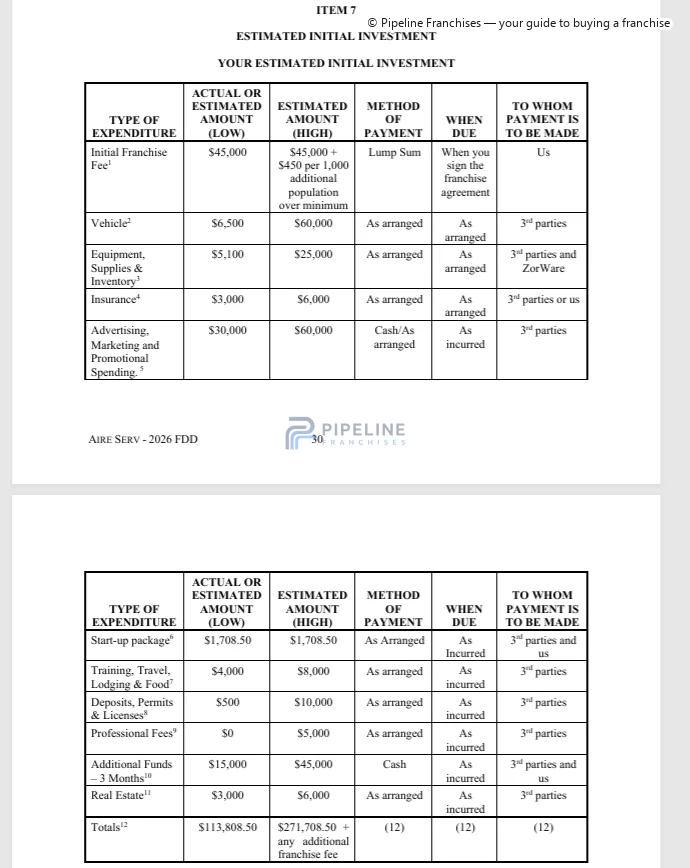
| 5 | Aire ServHVACInvestment: $113,308–$271,708 Item 7 source | 70.19Tier 3 · Mixed modeled alignment | +0.66 pts410,053 residents in 2025; +6.2% from the 2020 estimates base… | -0.41 pts$21.46/hour vs $17.86 U.S | High evidence confidence |
| 6 | Mister Sparky ElectricElectrical Services | 70.13Tier 3 · Mixed modeled alignment | +0.73 pts410,053 residents in 2025; +6.2% from the 2020 estimates base… | -0.40 pts62.4% owner-occupied owner-occupied housing share | High evidence confidence |
| 7 | City Wide Facility SolutionsIntegrated Facility Management | 70.10Tier 3 · Mixed modeled alignment | +0.20 pts10.5% of metro employment vs 6.8% nationally business and financial… | -0.10 pts$21.46/hour vs $17.86 U.S | High evidence confidence |
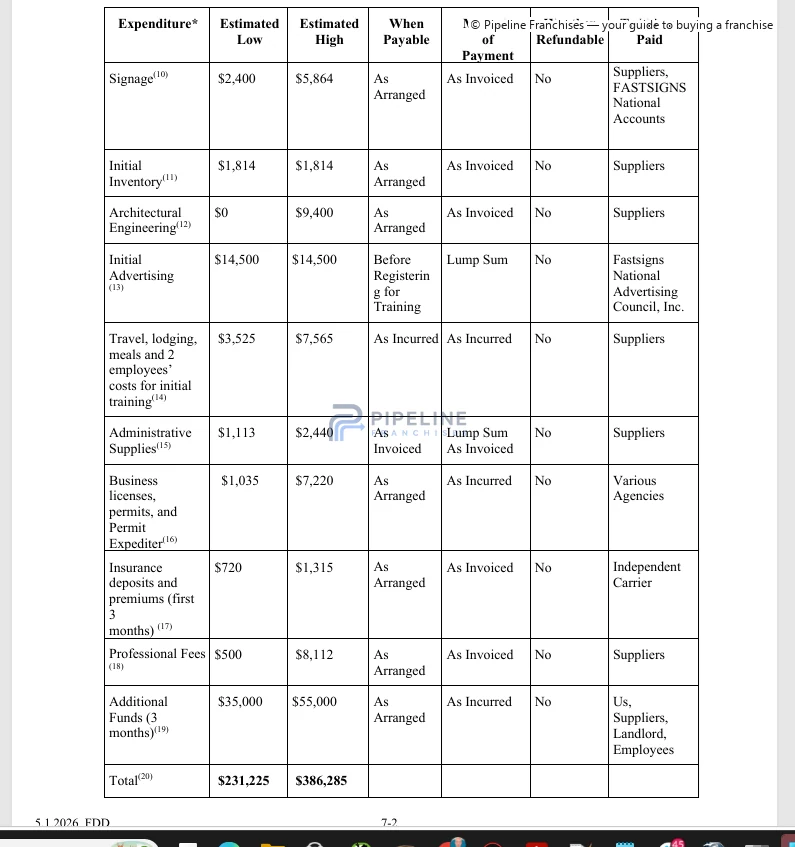
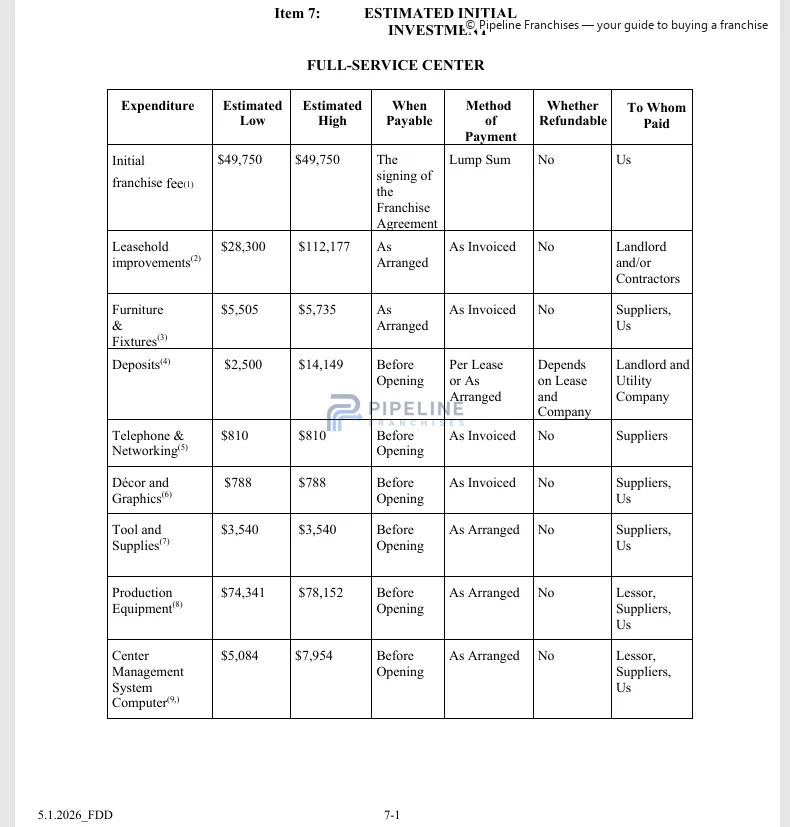
| 8 | FASTSIGNSSigns & GraphicsInvestment: $231,226–$386,285 Item 7 source | 69.82Tier 3 · Mixed modeled alignment | No material positive scored relationship | -0.18 pts$21.46/hour vs $17.86 U.S | High evidence confidence |
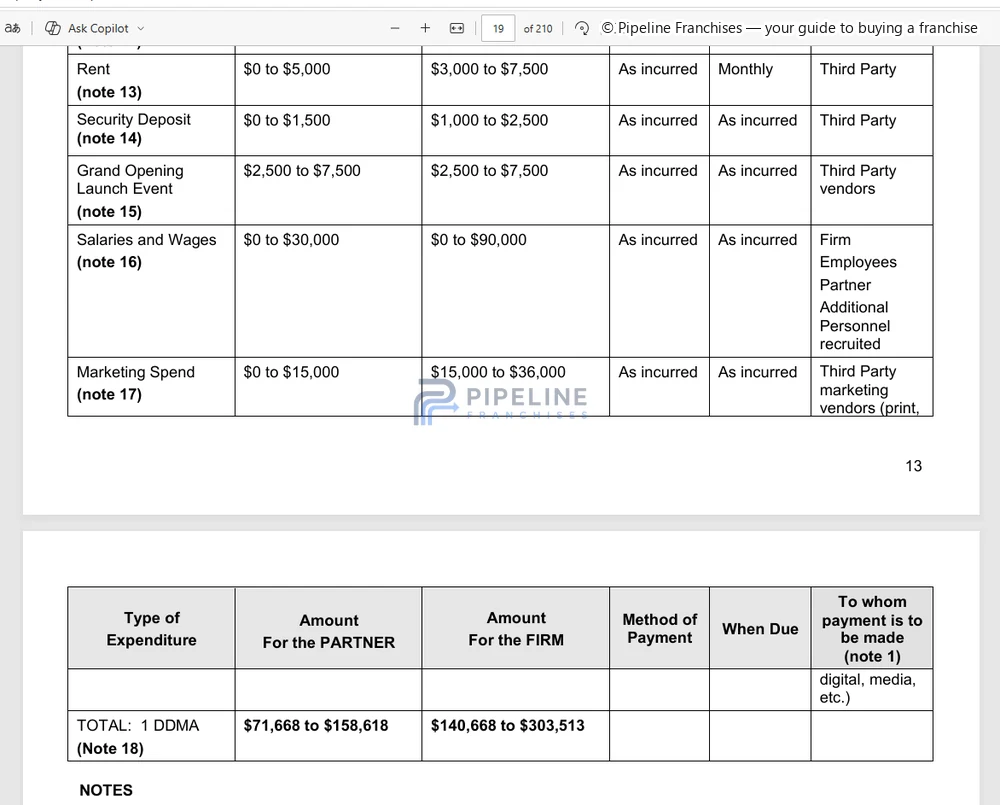
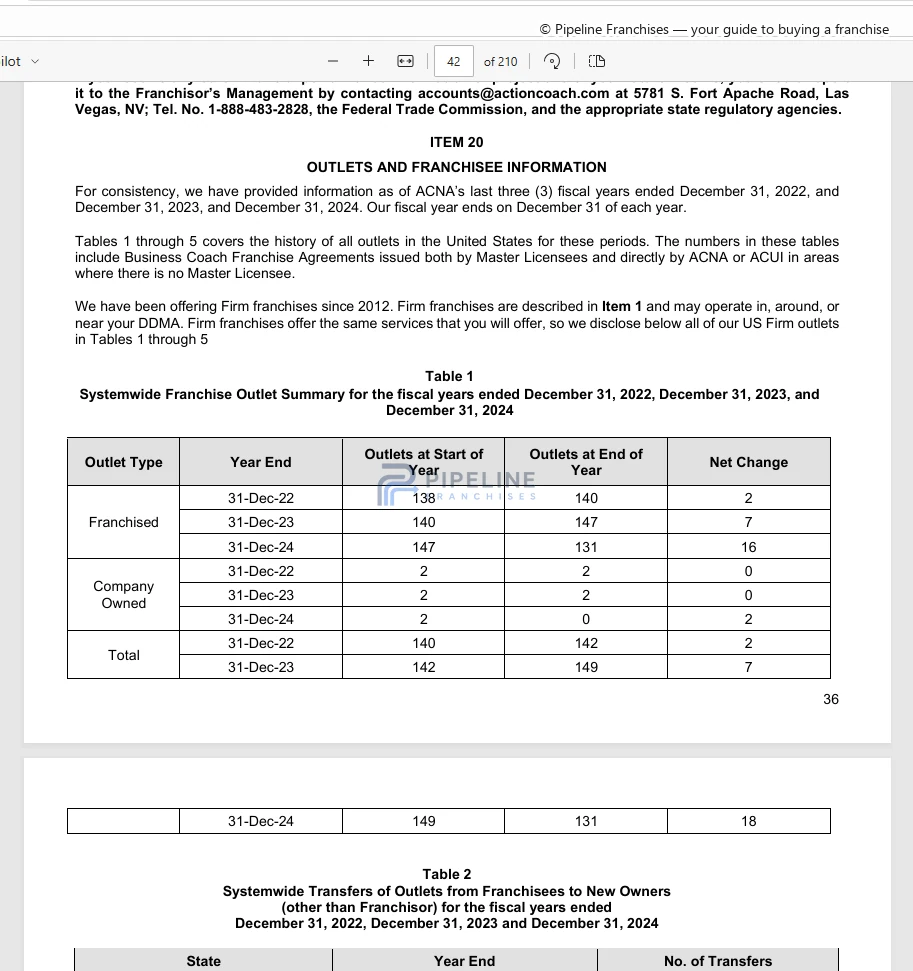
| 9 | ActionCOACHBusiness CoachingInvestment: $71,668–$303,513 Item 7 source | 69.72Tier 3 · Mixed modeled alignment | No material positive scored relationship | -0.28 pts10.5% of metro employment vs 6.8% nationally business and financial… | High evidence confidence |
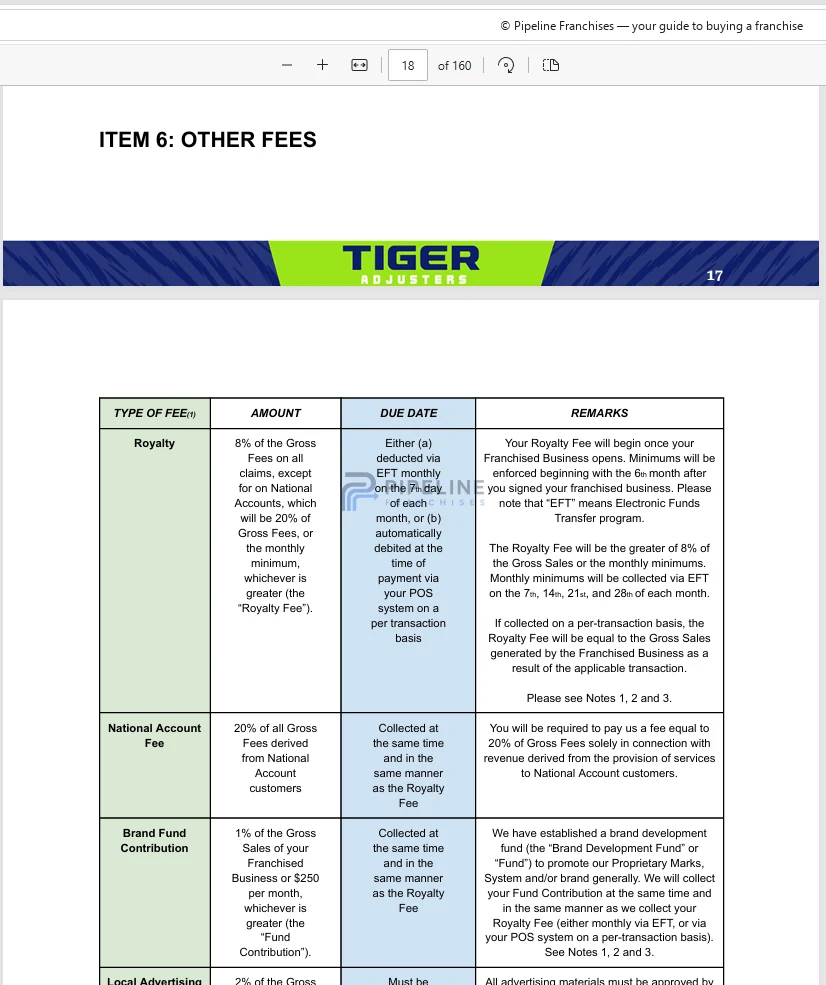
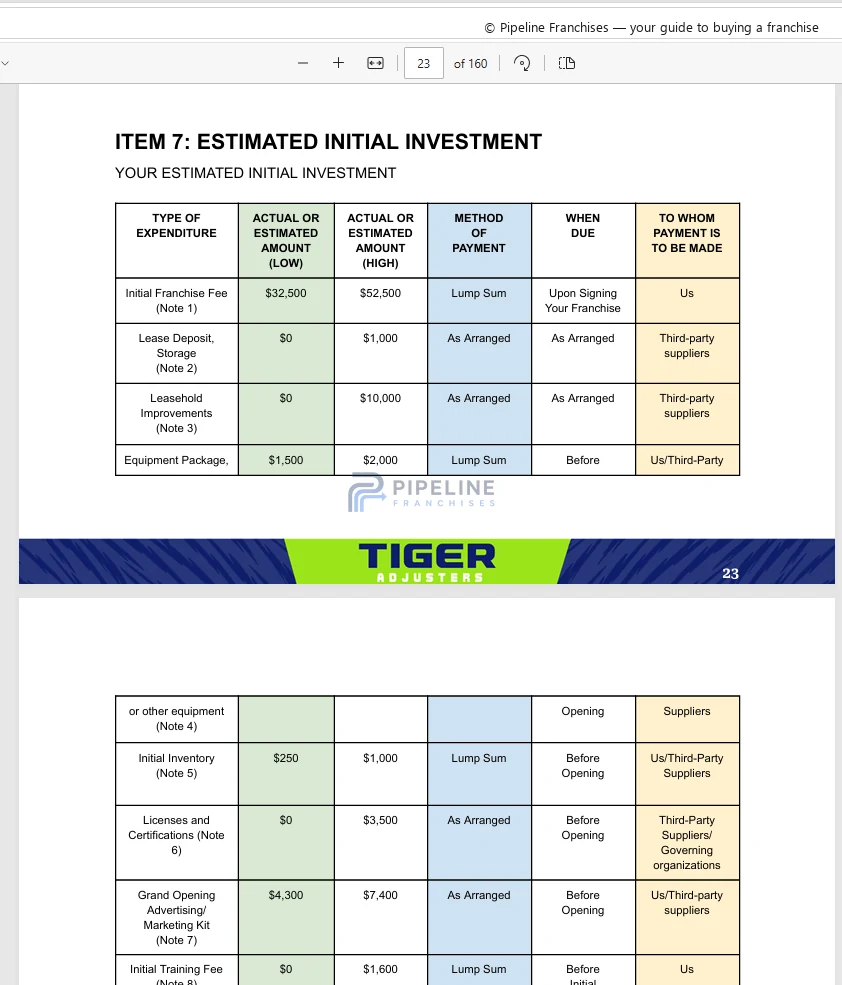
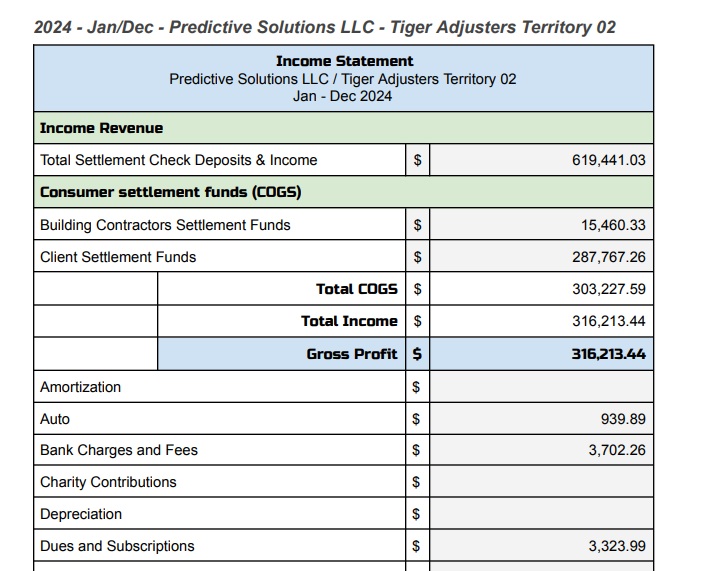
| 10 | Tiger AdjustersPublic Adjusting & Claims AdvocacyInvestment: $43,050–$159,500 Item 7 source | 69.72Tier 3 · Mixed modeled alignment | +0.16 pts410,053 residents in 2025; +6.2% from the 2020 estimates base… | -0.29 pts62.4% owner-occupied owner-occupied housing share | High evidence confidence |
Cross-concept impact analysis
A city condition changes a franchise score only when it intersects with a relevant operating-model exposure. The center shows average effect when applied; the surrounding ring shows how broadly that relationship reached across the concepts assessed.
Most relevant modeled attributes: scheduled residential service, recurring residential demand, and housing turnover dependency.
Most relevant modeled attributes: skilled trade labor, technical labor, and administrative labor.
Most relevant modeled attributes: homeownership dependency.
Most relevant modeled attributes: plumbing service, property age demand sensitivity, and hvac service.
Most relevant modeled attributes: insured population dependency.
Modeled evidence traces
Each trace follows one documented local condition through resolved operating-model exposure, exact score contribution, and the resulting modeled difference. Open either image for the full-size analytical view.
Why the ranking came out this way
The comparison, score path, and counterfactual below all use the same contribution ledger as the published ranking.
The modeled gap is small enough that the two concepts should be treated as a leading cluster rather than a decisive first and second place.
| Modeled relationship | Pillar To Post Home Inspectors | Mr. Rooter | Difference |
|---|---|---|---|
| 15.6% moved since the previous year moved since previous year [3] | +0.90 pts | 0.00 pts | +0.90 pts |
| Average hardness 136 mg/L as CaCO3 (range 87-198), within the USGS hard-water band at the average. drinking-water hardness [15] [16] | +0.11 pts | +0.79 pts | -0.69 pts |
| $21.46/hour vs $17.86 U.S. mean wage for food preparation and serving occupations [6] | -0.29 pts | -0.40 pts | +0.11 pts |
Aurora's 15.6% moved since the previous year moved since previous year created the largest modeled gap in this head-to-head: +0.90 points for Pillar To Post Home Inspectors versus 0.00 points for Mr. Rooter. [3]
Pillar To Post Home Inspectors, Mr. Rooter, and ZOOM DRAIN gained more than the rest of the field from Average hardness 136 mg/L as CaCO3 (range 87-198), within the USGS hard-water band at the average. drinking-water hardness and 410,053 residents in 2025; +6.2% from the 2020 estimates base population growth since 2020. The ordering is assumption-sensitive for Pillar To Post Home Inspectors and ZOOM DRAIN when individual factors are neutralized and the model is rerun. The same city condition can help one operating model while constraining another, so this ranking describes local operating alignment rather than universal franchise quality. [15] [16] [1] [2]
Every factor is classified. Factor values here are net totals; the score-changing relationship table above preserves material positive and negative drivers even when they offset inside the same factor.
| Neutral model baseline | 70.00 |
|---|---|
| Target-market demand | +1.19 |
| Property replacement-cycle demand | +0.11 |
| Competitive environment | Not included in the score |
| Labor and staffing friction | -0.29 |
| Transportation, routing, and parking | Potential candidate-specific adjustment |
| Real estate and site feasibility | Not included in the score |
| Sales and customer acquisition | Not included in the score |
| Referral ecosystem | Measured; no meaningful local adjustment |
| Territory quality | Not included in the score |
| Regulatory and operating friction | Not applicable to this operating model |
| Full-precision calculated score | 70.998 |
| Published local-market alignment | 71.00 |
Factor calculations use full precision. Contributions and published scores are displayed to two decimal places; ranking order uses the full-precision score.
Inside the analysis workflow
Methodology-reference views of the research and QA workflow. Open any image for the full-size version.
Evaluation set
This is not a ranking of every franchise that may be offered in the city.
Concepts were included when the available operating-model evidence supported a deterministic local-sensitivity profile. Brand participation in our referral network does not affect the score.
A brand’s participation in our referral network does not add points or change its position.
City-level conclusions
70.67 average across 2 concepts
0.30 points average among 8 affected concepts
0.26 points average reduction among 13 affected concepts
Tested rank range spans 9 positions
Conditions that changed the analysis
This relationship affected 8 concepts and added 0.55 points on average among those exposed. Local evidence: 410,053 residents in 2025; +6.2% from the 2020 estimates base population growth since 2020. [1] [2]
This relationship affected 13 concepts and reduced 0.26 points on average among those exposed. Local evidence: $21.46/hour vs $17.86 U.S. mean wage for food preparation and serving occupations. [6]
Compare all assessed concepts
14 concepts shown. Expand a concept to see every material score-changing relationship, with factor net shown only as secondary context; the full audit ledger stays collapsed.
Initial investment: $102,690–$134,290 · Item 7 evidence below
Rank sensitivity: Highly sensitive
Score-changing local relationships are grouped by factor. Each factor subtotal shows the net contribution after model controls.
5 material local relationships changed this score: 3 advantages and 2 constraints.
| Scored local driver | Effect | Evidence |
|---|---|---|
| 15.6% moved since the previous year moved since previous yearLargest driverRelationship test: Rank #1 to #6 without this driver. | +0.90 pts | HighEvidence |
| 410,053 residents in 2025; +6.2% from the 2020 estimates base population growth since 2020 | +0.62 pts | HighEvidence |
| 62.4% owner-occupied owner-occupied housing share | -0.33 pts | HighEvidence |
| Scored local driver | Effect | Evidence |
|---|---|---|
| $21.46/hour vs $17.86 U.S. mean wage for food preparation and serving occupations | -0.29 pts | HighEvidence |
| Scored local driver | Effect | Evidence |
|---|---|---|
| Average hardness 136 mg/L as CaCO3 (range 87-198), within the USGS hard-water band at the average. drinking-water hardness | +0.11 pts | HighEvidence |
Relationship effects are shown individually. Factor net values are secondary subtotals. Any scored relationship below the public materiality threshold is reconciled in the accounting residual.
Franchise evidence
Audit layer
Every factor is classified. Factor values here are net totals; the score-changing relationship table above preserves material positive and negative drivers even when they offset inside the same factor.
| Neutral model baseline | 70.00 |
|---|---|
| Target-market demand | +1.19 |
| Property replacement-cycle demand | +0.11 |
| Competitive environment | Not included in the score |
| Labor and staffing friction | -0.29 |
| Transportation, routing, and parking | Potential candidate-specific adjustment |
| Real estate and site feasibility | Not included in the score |
| Sales and customer acquisition | Not included in the score |
| Referral ecosystem | Measured; no meaningful local adjustment |
| Territory quality | Not included in the score |
| Regulatory and operating friction | Not applicable to this operating model |
| Full-precision calculated score | 70.998 |
| Published local-market alignment | 71.00 |
Factor calculations use full precision. Contributions and published scores are displayed to two decimal places; ranking order uses the full-precision score.
Initial investment: $152,900–$298,675 · Item 7 evidence below
Rank sensitivity: Moderately sensitive
Score-changing local relationships are grouped by factor. Each factor subtotal shows the net contribution after model controls.
4 material local relationships changed this score: 2 advantages and 2 constraints.
| Scored local driver | Effect | Evidence |
|---|---|---|
| Average hardness 136 mg/L as CaCO3 (range 87-198), within the USGS hard-water band at the average. drinking-water hardnessLargest driverRelationship test: Rank #2 to #5 without this driver. | +0.79 pts | HighEvidence |
| Scored local driver | Effect | Evidence |
|---|---|---|
| $21.46/hour vs $17.86 U.S. mean wage for food preparation and serving occupations | -0.40 pts | HighEvidence |
Applicability depends on candidate-specific site, territory, customer, project, or operating selections
Applicability depends on the selected corridor
Relationship effects are shown individually. Factor net values are secondary subtotals. Any scored relationship below the public materiality threshold is reconciled in the accounting residual.
Franchise evidence
Audit layer
Every factor is classified. Factor values here are net totals; the score-changing relationship table above preserves material positive and negative drivers even when they offset inside the same factor.
| Neutral model baseline | 70.00 |
|---|---|
| Target-market demand | +0.33 |
| Property replacement-cycle demand | +0.79 |
| Competitive environment | Not included in the score |
| Labor and staffing friction | -0.40 |
| Transportation, routing, and parking | Potential candidate-specific adjustment |
| Real estate and site feasibility | Not included in the score |
| Sales and customer acquisition | Not included in the score |
| Referral ecosystem | Measured; no meaningful local adjustment |
| Territory quality | Not included in the score |
| Regulatory and operating friction | Not applicable to this operating model |
| Full-precision calculated score | 70.721 |
| Published local-market alignment | 70.72 |
Factor calculations use full precision. Contributions and published scores are displayed to two decimal places; ranking order uses the full-precision score.
Initial investment: $266,250–$570,500 · Item 7 evidence below
Rank sensitivity: Highly sensitive
Score-changing local relationships are grouped by factor. Each factor subtotal shows the net contribution after model controls.
4 material local relationships changed this score: 2 advantages and 2 constraints.
| Scored local driver | Effect | Evidence |
|---|---|---|
| Average hardness 136 mg/L as CaCO3 (range 87-198), within the USGS hard-water band at the average. drinking-water hardnessLargest driverRelationship test: Rank #3 to #7 without this driver. | +0.79 pts | HighEvidence |
| Scored local driver | Effect | Evidence |
|---|---|---|
| $21.46/hour vs $17.86 U.S. mean wage for food preparation and serving occupations | -0.40 pts | HighEvidence |
Applicability depends on candidate-specific site, territory, customer, project, or operating selections
Relationship effects are shown individually. Factor net values are secondary subtotals. Any scored relationship below the public materiality threshold is reconciled in the accounting residual.
Franchise evidence
Audit layer
Every factor is classified. Factor values here are net totals; the score-changing relationship table above preserves material positive and negative drivers even when they offset inside the same factor.
| Neutral model baseline | 70.00 |
|---|---|
| Target-market demand | +0.23 |
| Property replacement-cycle demand | +0.79 |
| Competitive environment | Not included in the score |
| Labor and staffing friction | -0.40 |
| Transportation, routing, and parking | Potential candidate-specific adjustment |
| Real estate and site feasibility | Not included in the score |
| Sales and customer acquisition | Not included in the score |
| Referral ecosystem | Measured; no meaningful local adjustment |
| Territory quality | Not included in the score |
| Regulatory and operating friction | Not applicable to this operating model |
| Full-precision calculated score | 70.618 |
| Published local-market alignment | 70.62 |
Factor calculations use full precision. Contributions and published scores are displayed to two decimal places; ranking order uses the full-precision score.
Initial investment: $148,110–$201,800 · Item 7 evidence below
Rank sensitivity: Highly sensitive
Score-changing local relationships are grouped by factor. Each factor subtotal shows the net contribution after model controls.
4 material local relationships changed this score: 2 advantages and 2 constraints.
| Scored local driver | Effect | Evidence |
|---|---|---|
| $21.46/hour vs $17.86 U.S. mean wage for food preparation and serving occupations | -0.32 pts | HighEvidence |
| Scored local driver | Effect | Evidence |
|---|---|---|
| Average hardness 136 mg/L as CaCO3 (range 87-198), within the USGS hard-water band at the average. drinking-water hardness | +0.09 pts | HighEvidence |
Relationship effects are shown individually. Factor net values are secondary subtotals. Any scored relationship below the public materiality threshold is reconciled in the accounting residual.
Franchise evidence
Audit layer
Every factor is classified. Factor values here are net totals; the score-changing relationship table above preserves material positive and negative drivers even when they offset inside the same factor.
| Neutral model baseline | 70.00 |
|---|---|
| Target-market demand | +0.49 |
| Property replacement-cycle demand | +0.09 |
| Competitive environment | Not included in the score |
| Labor and staffing friction | -0.32 |
| Transportation, routing, and parking | Potential candidate-specific adjustment |
| Real estate and site feasibility | Not included in the score |
| Sales and customer acquisition | Not included in the score |
| Referral ecosystem | Measured; no meaningful local adjustment |
| Territory quality | Not included in the score |
| Regulatory and operating friction | Not applicable to this operating model |
| Full-precision calculated score | 70.255 |
| Published local-market alignment | 70.26 |
Factor calculations use full precision. Contributions and published scores are displayed to two decimal places; ranking order uses the full-precision score.
Initial investment: $113,308–$271,708 · Item 7 evidence below
Rank sensitivity: Moderately sensitive
Score-changing local relationships are grouped by factor. Each factor subtotal shows the net contribution after model controls.
4 material local relationships changed this score: 2 advantages and 2 constraints.
| Scored local driver | Effect | Evidence |
|---|---|---|
| $21.46/hour vs $17.86 U.S. mean wage for food preparation and serving occupations | -0.41 pts | HighEvidence |
| Scored local driver | Effect | Evidence |
|---|---|---|
| Average hardness 136 mg/L as CaCO3 (range 87-198), within the USGS hard-water band at the average. drinking-water hardness | +0.27 pts | HighEvidence |
Applicability depends on the selected corridor
Relationship effects are shown individually. Factor net values are secondary subtotals. Any scored relationship below the public materiality threshold is reconciled in the accounting residual.
Franchise evidence
Audit layer
Every factor is classified. Factor values here are net totals; the score-changing relationship table above preserves material positive and negative drivers even when they offset inside the same factor.
| Neutral model baseline | 70.00 |
|---|---|
| Target-market demand | +0.33 |
| Property replacement-cycle demand | +0.27 |
| Competitive environment | Not included in the score |
| Labor and staffing friction | -0.41 |
| Transportation, routing, and parking | Potential candidate-specific adjustment |
| Real estate and site feasibility | Not included in the score |
| Sales and customer acquisition | Not included in the score |
| Referral ecosystem | Measured; no meaningful local adjustment |
| Territory quality | Not included in the score |
| Regulatory and operating friction | Not applicable to this operating model |
| Full-precision calculated score | 70.187 |
| Published local-market alignment | 70.19 |
Factor calculations use full precision. Contributions and published scores are displayed to two decimal places; ranking order uses the full-precision score.
Rank sensitivity: Highly sensitive
Score-changing local relationships are grouped by factor. Each factor subtotal shows the net contribution after model controls.
4 material local relationships changed this score: 2 advantages and 2 constraints.
| Scored local driver | Effect | Evidence |
|---|---|---|
| $21.46/hour vs $17.86 U.S. mean wage for food preparation and serving occupations | -0.34 pts | HighEvidence |
| Scored local driver | Effect | Evidence |
|---|---|---|
| Average hardness 136 mg/L as CaCO3 (range 87-198), within the USGS hard-water band at the average. drinking-water hardness | +0.15 pts | HighEvidence |
Applicability depends on candidate-specific site, territory, customer, project, or operating selections
Relationship effects are shown individually. Factor net values are secondary subtotals. Any scored relationship below the public materiality threshold is reconciled in the accounting residual.
Audit layer
Every factor is classified. Factor values here are net totals; the score-changing relationship table above preserves material positive and negative drivers even when they offset inside the same factor.
| Neutral model baseline | 70.00 |
|---|---|
| Target-market demand | +0.32 |
| Property replacement-cycle demand | +0.15 |
| Competitive environment | Not included in the score |
| Labor and staffing friction | -0.34 |
| Transportation, routing, and parking | Potential candidate-specific adjustment |
| Real estate and site feasibility | Not included in the score |
| Sales and customer acquisition | Not included in the score |
| Referral ecosystem | Measured; no meaningful local adjustment |
| Territory quality | Not included in the score |
| Regulatory and operating friction | Not applicable to this operating model |
| Full-precision calculated score | 70.125 |
| Published local-market alignment | 70.13 |
Factor calculations use full precision. Contributions and published scores are displayed to two decimal places; ranking order uses the full-precision score.
Rank sensitivity: Highly sensitive
Score-changing local relationships are grouped by factor. Each factor subtotal shows the net contribution after model controls.
2 material local relationships changed this score: 1 advantage and 1 constraint.
| Scored local driver | Effect | Evidence |
|---|---|---|
| 10.5% of metro employment vs 6.8% nationally business and financial operations employment shareLargest driverRelationship test: Rank stays #7 without this driver. | +0.20 pts | HighEvidence |
| Scored local driver | Effect | Evidence |
|---|---|---|
| $21.46/hour vs $17.86 U.S. mean wage for food preparation and serving occupations | -0.10 pts | HighEvidence |
Relationship effects are shown individually. Factor net values are secondary subtotals. Any scored relationship below the public materiality threshold is reconciled in the accounting residual.
Audit layer
Every factor is classified. Factor values here are net totals; the score-changing relationship table above preserves material positive and negative drivers even when they offset inside the same factor.
| Neutral model baseline | 70.00 |
|---|---|
| Target-market demand | +0.20 |
| Property replacement-cycle demand | Not applicable to this operating model |
| Competitive environment | Not included in the score |
| Labor and staffing friction | -0.10 |
| Transportation, routing, and parking | Potential candidate-specific adjustment |
| Real estate and site feasibility | Not included in the score |
| Sales and customer acquisition | Not included in the score |
| Referral ecosystem | Measured; no meaningful local adjustment |
| Territory quality | Not included in the score |
| Regulatory and operating friction | Not applicable to this operating model |
| Full-precision calculated score | 70.099 |
| Published local-market alignment | 70.10 |
Factor calculations use full precision. Contributions and published scores are displayed to two decimal places; ranking order uses the full-precision score.
Initial investment: $231,226–$386,285 · Item 7 evidence below
Rank sensitivity: Moderately sensitive
Score-changing local relationships are grouped by factor. Each factor subtotal shows the net contribution after model controls.
1 material local relationships changed this score: 0 advantages and 1 constraint.
| Scored local driver | Effect | Evidence |
|---|---|---|
| $21.46/hour vs $17.86 U.S. mean wage for food preparation and serving occupationsLargest driverRelationship test: Rank #8 to #11 without this driver. | -0.18 pts | HighEvidence |
Relationship effects are shown individually. Factor net values are secondary subtotals. Any scored relationship below the public materiality threshold is reconciled in the accounting residual.
Franchise evidence
Audit layer
Every factor is classified. Factor values here are net totals; the score-changing relationship table above preserves material positive and negative drivers even when they offset inside the same factor.
| Neutral model baseline | 70.00 |
|---|---|
| Target-market demand | Not applicable to this operating model |
| Property replacement-cycle demand | Not applicable to this operating model |
| Competitive environment | Not included in the score |
| Labor and staffing friction | -0.18 |
| Transportation, routing, and parking | Potential candidate-specific adjustment |
| Real estate and site feasibility | Not included in the score |
| Sales and customer acquisition | Not included in the score |
| Referral ecosystem | Measured; no meaningful local adjustment |
| Territory quality | Not included in the score |
| Regulatory and operating friction | Not applicable to this operating model |
| Full-precision calculated score | 69.820 |
| Published local-market alignment | 69.82 |
Factor calculations use full precision. Contributions and published scores are displayed to two decimal places; ranking order uses the full-precision score.
Initial investment: $71,668–$303,513 · Item 7 evidence below
Rank sensitivity: Moderately sensitive
Score-changing local relationships are grouped by factor. Each factor subtotal shows the net contribution after model controls.
1 material local relationships changed this score: 0 advantages and 1 constraint.
| Scored local driver | Effect | Evidence |
|---|---|---|
| 10.5% of metro employment vs 6.8% nationally business and financial operations employment shareLargest driverRelationship test: Rank stays #9 without this driver. | -0.28 pts | HighEvidence |
Relationship effects are shown individually. Factor net values are secondary subtotals. Any scored relationship below the public materiality threshold is reconciled in the accounting residual.
Franchise evidence
Audit layer
Every factor is classified. Factor values here are net totals; the score-changing relationship table above preserves material positive and negative drivers even when they offset inside the same factor.
| Neutral model baseline | 70.00 |
|---|---|
| Target-market demand | Not applicable to this operating model |
| Property replacement-cycle demand | Not applicable to this operating model |
| Competitive environment | Not included in the score |
| Labor and staffing friction | Not applicable to this operating model |
| Transportation, routing, and parking | Potential candidate-specific adjustment |
| Real estate and site feasibility | Not included in the score |
| Sales and customer acquisition | -0.28 |
| Referral ecosystem | Measured; no meaningful local adjustment |
| Territory quality | Not included in the score |
| Regulatory and operating friction | Not applicable to this operating model |
| Full-precision calculated score | 69.724 |
| Published local-market alignment | 69.72 |
Factor calculations use full precision. Contributions and published scores are displayed to two decimal places; ranking order uses the full-precision score.
Initial investment: $43,050–$159,500 · Item 7 evidence below
Rank sensitivity: Highly sensitive
Score-changing local relationships are grouped by factor. Each factor subtotal shows the net contribution after model controls.
3 material local relationships changed this score: 1 advantage and 2 constraints.
| Scored local driver | Effect | Evidence |
|---|---|---|
| $21.46/hour vs $17.86 U.S. mean wage for food preparation and serving occupations | -0.15 pts | HighEvidence |
Relationship effects are shown individually. Factor net values are secondary subtotals. Any scored relationship below the public materiality threshold is reconciled in the accounting residual.
Franchise evidence
Audit layer
Every factor is classified. Factor values here are net totals; the score-changing relationship table above preserves material positive and negative drivers even when they offset inside the same factor.
| Neutral model baseline | 70.00 |
|---|---|
| Target-market demand | -0.13 |
| Property replacement-cycle demand | Not applicable to this operating model |
| Competitive environment | Not included in the score |
| Labor and staffing friction | -0.15 |
| Transportation, routing, and parking | Potential candidate-specific adjustment |
| Real estate and site feasibility | Not included in the score |
| Sales and customer acquisition | Not included in the score |
| Referral ecosystem | Measured; no meaningful local adjustment |
| Territory quality | Not included in the score |
| Regulatory and operating friction | Not applicable to this operating model |
| Full-precision calculated score | 69.718 |
| Published local-market alignment | 69.72 |
Factor calculations use full precision. Contributions and published scores are displayed to two decimal places; ranking order uses the full-precision score.
Initial investment: $1,060,850–$1,840,550 · Item 7 evidence below
Rank sensitivity: Highly sensitive
Score-changing local relationships are grouped by factor. Each factor subtotal shows the net contribution after model controls.
4 material local relationships changed this score: 1 advantage and 3 constraints.
| Scored local driver | Effect | Evidence |
|---|---|---|
| Grease interceptors are required for food-preparation establishments and other listed FOG-generating uses, subject to a feasibility variance process. grease-interceptor requirement for food-preparation establishmentsLargest driverRelationship test: Rank #11 to #9 without this driver. | -0.21 pts | HighEvidence |
| Required backflow assemblies must be tested upon installation and at least annually by a certified technician. backflow-prevention testing requirement | -0.09 pts | HighEvidence |
| Scored local driver | Effect | Evidence |
|---|---|---|
| $21.46/hour vs $17.86 U.S. mean wage for food preparation and serving occupations | -0.15 pts | HighEvidence |
| Scored local driver | Effect | Evidence |
|---|---|---|
| 410,053 residents in 2025; +6.2% from the 2020 estimates base population growth since 2020 | +0.15 pts | HighEvidence |
Applicability depends on candidate-specific site, territory, customer, project, or operating selections
Relationship effects are shown individually. Factor net values are secondary subtotals. Any scored relationship below the public materiality threshold is reconciled in the accounting residual.
Franchise evidence
Audit layer
Every factor is classified. Factor values here are net totals; the score-changing relationship table above preserves material positive and negative drivers even when they offset inside the same factor.
| Neutral model baseline | 70.00 |
|---|---|
| Target-market demand | +0.15 |
| Property replacement-cycle demand | Not applicable to this operating model |
| Competitive environment | Not included in the score |
| Labor and staffing friction | -0.15 |
| Transportation, routing, and parking | Potential candidate-specific adjustment |
| Real estate and site feasibility | Not included in the score |
| Sales and customer acquisition | Not included in the score |
| Referral ecosystem | Measured; no meaningful local adjustment |
| Territory quality | Not included in the score |
| Regulatory and operating friction | -0.30 |
| Full-precision calculated score | 69.697 |
| Published local-market alignment | 69.70 |
Factor calculations use full precision. Contributions and published scores are displayed to two decimal places; ranking order uses the full-precision score.
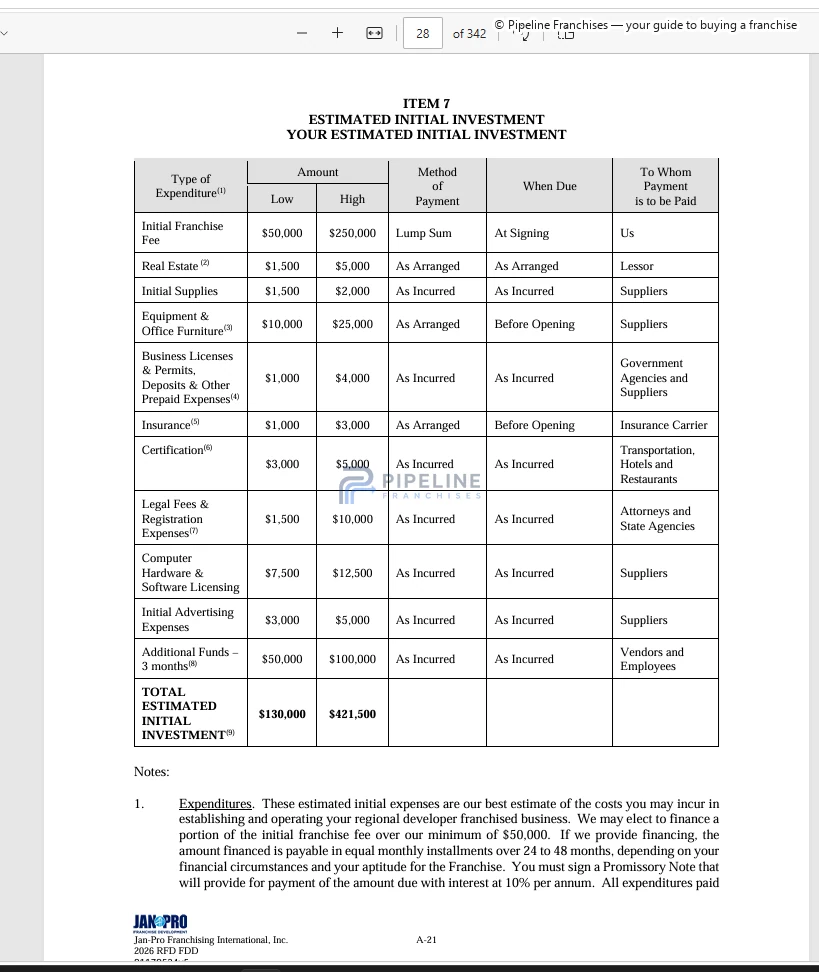
Initial investment: $130,000–$421,500 · Item 7 evidence below
Rank sensitivity: Stable
Score-changing local relationships are grouped by factor. Each factor subtotal shows the net contribution after model controls.
2 material local relationships changed this score: 0 advantages and 2 constraints.
| Scored local driver | Effect | Evidence |
|---|---|---|
| 10.5% of metro employment vs 6.8% nationally business and financial operations employment shareLargest driverRelationship test: Rank stays #12 without this driver. | -0.30 pts | HighEvidence |
| Scored local driver | Effect | Evidence |
|---|---|---|
| $21.46/hour vs $17.86 U.S. mean wage for food preparation and serving occupations | -0.07 pts | HighEvidence |
Relationship effects are shown individually. Factor net values are secondary subtotals. Any scored relationship below the public materiality threshold is reconciled in the accounting residual.
Franchise evidence
Audit layer
Every factor is classified. Factor values here are net totals; the score-changing relationship table above preserves material positive and negative drivers even when they offset inside the same factor.
| Neutral model baseline | 70.00 |
|---|---|
| Target-market demand | Not applicable to this operating model |
| Property replacement-cycle demand | Not applicable to this operating model |
| Competitive environment | Not included in the score |
| Labor and staffing friction | -0.07 |
| Transportation, routing, and parking | Potential candidate-specific adjustment |
| Real estate and site feasibility | Not included in the score |
| Sales and customer acquisition | -0.30 |
| Referral ecosystem | Measured; no meaningful local adjustment |
| Territory quality | Not included in the score |
| Regulatory and operating friction | Not applicable to this operating model |
| Full-precision calculated score | 69.624 |
| Published local-market alignment | 69.62 |
Factor calculations use full precision. Contributions and published scores are displayed to two decimal places; ranking order uses the full-precision score.
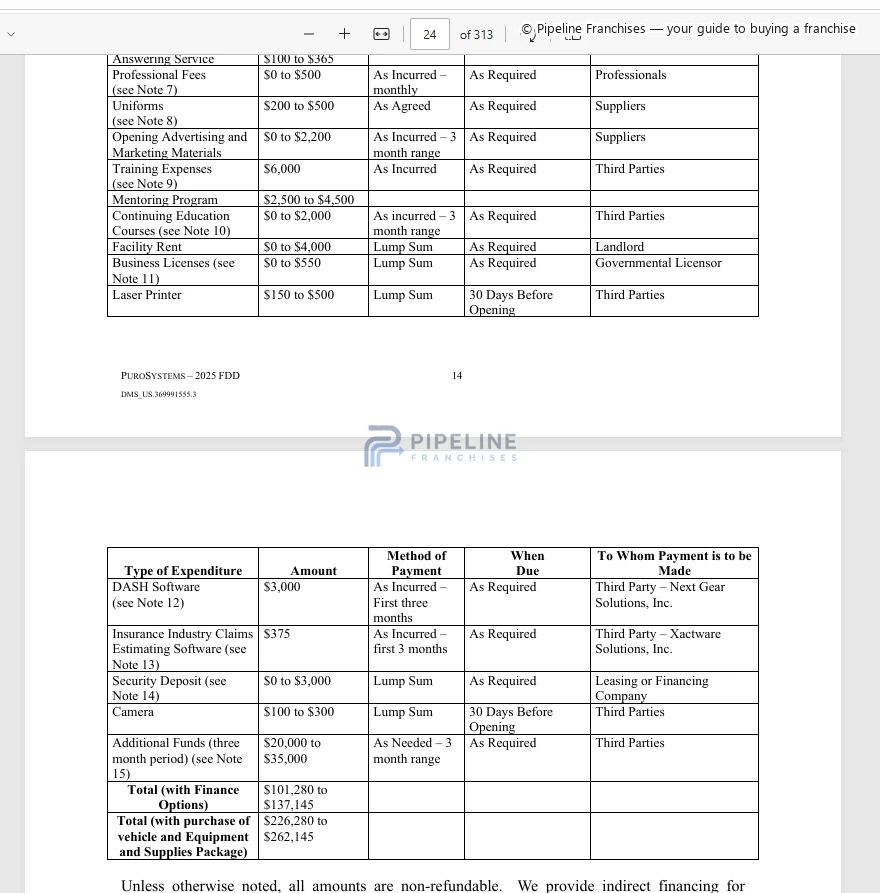
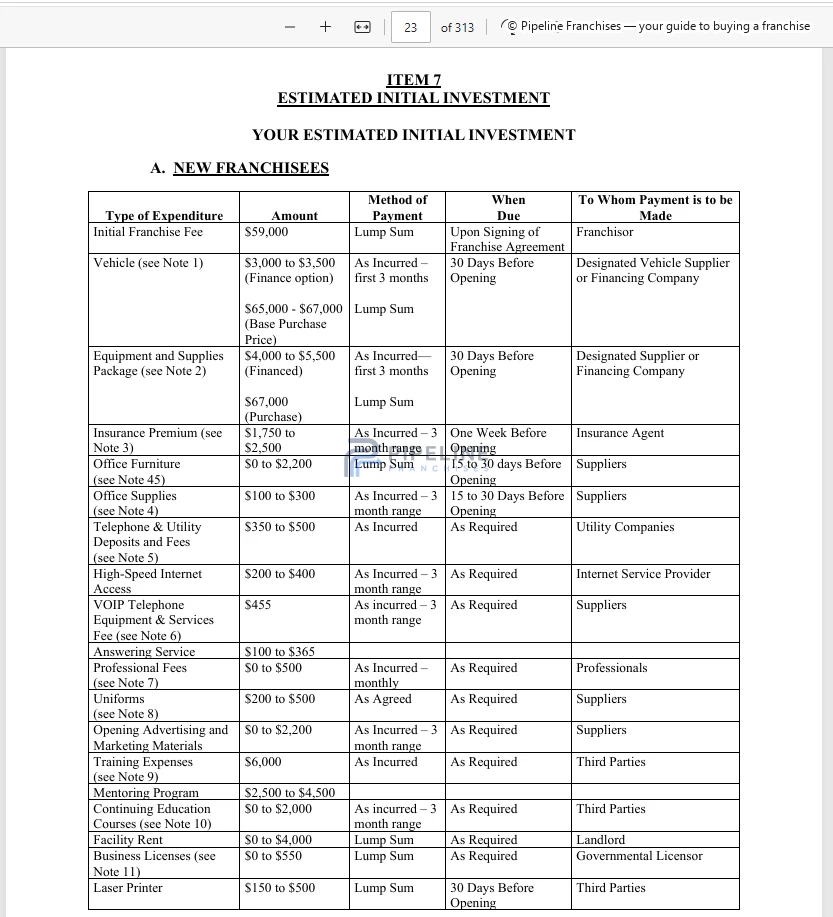
Initial investment: $54,575–$262,145 · Item 7 evidence below
Rank sensitivity: Highly sensitive
Score-changing local relationships are grouped by factor. Each factor subtotal shows the net contribution after model controls.
3 material local relationships changed this score: 1 advantage and 2 constraints.
| Scored local driver | Effect | Evidence |
|---|---|---|
| $21.46/hour vs $17.86 U.S. mean wage for food preparation and serving occupationsLargest driverRelationship test: Rank #13 to #8 without this driver. | -0.27 pts | HighEvidence |
| Scored local driver | Effect | Evidence |
|---|---|---|
| 62.4% owner-occupied owner-occupied housing share | -0.22 pts | HighEvidence |
| Scored local driver | Effect | Evidence |
|---|---|---|
| Average hardness 136 mg/L as CaCO3 (range 87-198), within the USGS hard-water band at the average. drinking-water hardness | +0.11 pts | HighEvidence |
Applicability depends on candidate-specific site, territory, customer, project, or operating selections
Applicability depends on the selected corridor
Applicability depends on candidate-specific site, territory, customer, project, or operating selections
Relationship effects are shown individually. Factor net values are secondary subtotals. Any scored relationship below the public materiality threshold is reconciled in the accounting residual.
Franchise evidence
Audit layer
Every factor is classified. Factor values here are net totals; the score-changing relationship table above preserves material positive and negative drivers even when they offset inside the same factor.
| Neutral model baseline | 70.00 |
|---|---|
| Target-market demand | -0.22 |
| Property replacement-cycle demand | +0.11 |
| Competitive environment | Not included in the score |
| Labor and staffing friction | -0.27 |
| Transportation, routing, and parking | Potential candidate-specific adjustment |
| Real estate and site feasibility | Not included in the score |
| Sales and customer acquisition | Not included in the score |
| Referral ecosystem | Measured; no meaningful local adjustment |
| Territory quality | Not included in the score |
| Regulatory and operating friction | Not applicable to this operating model |
| Full-precision calculated score | 69.618 |
| Published local-market alignment | 69.62 |
Factor calculations use full precision. Contributions and published scores are displayed to two decimal places; ranking order uses the full-precision score.
Initial investment: $185,336–$351,900 · Item 7 evidence below
Rank sensitivity: Highly sensitive
Score-changing local relationships are grouped by factor. Each factor subtotal shows the net contribution after model controls.
4 material local relationships changed this score: 1 advantage and 3 constraints.
| Scored local driver | Effect | Evidence |
|---|---|---|
| $21.46/hour vs $17.86 U.S. mean wage for food preparation and serving occupations | -0.27 pts | HighEvidence |
| Scored local driver | Effect | Evidence |
|---|---|---|
| Average hardness 136 mg/L as CaCO3 (range 87-198), within the USGS hard-water band at the average. drinking-water hardness | +0.11 pts | HighEvidence |
Applicability depends on candidate-specific site, territory, customer, project, or operating selections
Applicability depends on the selected corridor
Applicability depends on candidate-specific site, territory, customer, project, or operating selections
Relationship effects are shown individually. Factor net values are secondary subtotals. Any scored relationship below the public materiality threshold is reconciled in the accounting residual.
Franchise evidence
Audit layer
Every factor is classified. Factor values here are net totals; the score-changing relationship table above preserves material positive and negative drivers even when they offset inside the same factor.
| Neutral model baseline | 70.00 |
|---|---|
| Target-market demand | -1.18 |
| Property replacement-cycle demand | +0.11 |
| Competitive environment | Not included in the score |
| Labor and staffing friction | -0.27 |
| Transportation, routing, and parking | Potential candidate-specific adjustment |
| Real estate and site feasibility | Not included in the score |
| Sales and customer acquisition | Not included in the score |
| Referral ecosystem | Measured; no meaningful local adjustment |
| Territory quality | Not included in the score |
| Regulatory and operating friction | Not applicable to this operating model |
| Full-precision calculated score | 68.661 |
| Published local-market alignment | 68.66 |
Factor calculations use full precision. Contributions and published scores are displayed to two decimal places; ranking order uses the full-precision score.
No franchise concepts match the selected filters.
Factor impact
We neutralized one factor at a time, recalculated every score, and then measured both absolute score movement and changes in rank order.
We tested how much of the city’s theoretical customer and business demand remained usable after operating friction.
We applied a measurable adjustment to 11 of 14 concepts. When we neutralized the factor and recalculated the table, 12 concepts changed position. Rainbow International Restoration moved from #14 to #6, the largest movement among concepts directly affected by this factor.
We compared the age and condition of relevant property systems with the services each concept is actually equipped to provide.
We applied a measurable adjustment to 8 of 14 concepts. When we neutralized the factor and recalculated the table, 6 concepts changed position. ZOOM DRAIN moved from #3 to #7, the largest movement among concepts directly affected by this factor.
We compared each concept’s frontline and specialist staffing requirements with the local labor environment.
We applied a measurable adjustment to 13 of 14 concepts. When we neutralized the factor and recalculated the table, 5 concepts changed position. PuroClean moved from #13 to #9, the largest movement among concepts directly affected by this factor.
We weighed the size of the prospect pool against local digital competition and the length of the relevant sales cycle.
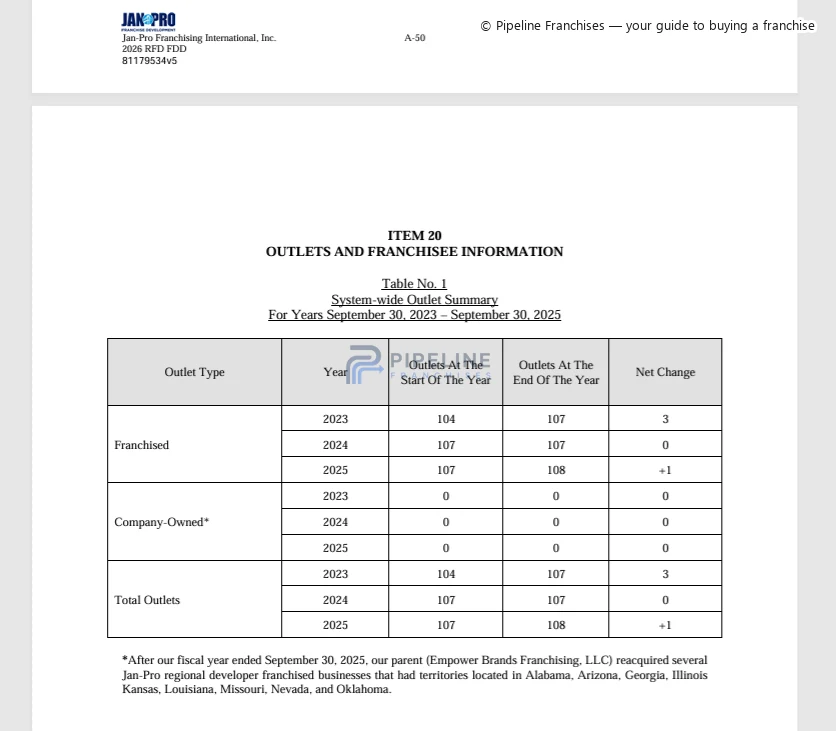
We applied a measurable adjustment to 2 of 14 concepts. When we neutralized the factor and recalculated the table, 5 concepts changed position. JAN-PRO International moved from #12 to #9, the largest movement among concepts directly affected by this factor.
We separated regulations that create operating burdens from those that may create demand for qualified compliance and retrofit services.
We applied a measurable adjustment to 1 of 14 concepts. When we neutralized the factor and recalculated the table, 4 concepts changed position. Workout Anytime moved from #11 to #8, the largest movement among concepts directly affected by this factor.
Rank stability
The line shows the best and worst rank reached when one factor was removed from every concept. A narrow range indicates a more stable position.
Neutralizing a factor removes it from every concept. A concept can move down even when its own score improves because competitors may benefit more.
Net factor impact
This graph plots net factor totals for the top 14 concepts. A near-zero net can contain meaningful positive and negative scored relationships that offset each other; those underlying drivers remain visible in each franchise's expanded score explanation.
| Concept | Target-market demand | Property replacement-cycle demand | Labor and staffing friction | Sales and customer acquisition | Regulatory and operating friction |
|---|---|---|---|---|---|
| #1 Pillar To Post Home Inspectors | +1.20 pts | +0.10 pts | -0.30 pts | — | — |
| #2 Mr. Rooter | +0.30 pts | +0.80 pts | -0.40 pts | — | — |
| #3 ZOOM DRAIN | +0.20 pts | +0.80 pts | -0.40 pts | — | — |
| #4 HomeSmiles | +0.50 pts | +0.10 pts | -0.30 pts | — | — |
| #5 Aire Serv | +0.30 pts | +0.30 pts | -0.40 pts | — | — |
| #6 Mister Sparky Electric | +0.30 pts | +0.10 pts | -0.30 pts | — | — |
| #7 City Wide Facility Solutions | +0.20 pts | — | -0.10 pts | — | — |
| #8 FASTSIGNS | — | — | -0.20 pts | — | — |
| #9 ActionCOACH | — | — | — | -0.30 pts | — |
| #10 Tiger Adjusters | -0.10 pts | — | -0.10 pts | — | — |
| #11 Workout Anytime | +0.10 pts | — | -0.20 pts | — | -0.30 pts |
| #12 JAN-PRO International | — | — | -0.10 pts | -0.30 pts | — |
| #13 PuroClean | -0.20 pts | +0.10 pts | -0.30 pts | — | — |
| #14 Rainbow International Restoration | -1.20 pts | +0.10 pts | -0.30 pts | — | — |
Interpretation
Pillar To Post Home Inspectors, Mr. Rooter, and ZOOM DRAIN gained more than the rest of the field from Average hardness 136 mg/L as CaCO3 (range 87-198), within the USGS hard-water band at the average. drinking-water hardness and 410,053 residents in 2025; +6.2% from the 2020 estimates base population growth since 2020. The ordering is assumption-sensitive for Pillar To Post Home Inspectors and ZOOM DRAIN when individual factors are neutralized and the model is rerun. The same city condition can help one operating model while constraining another, so this ranking describes local operating alignment rather than universal franchise quality.
Category comparisons
Category summaries are shown only when at least two concepts qualified. Two-concept comparisons are explicitly labeled as limited.
2 Plumbing & Drain Services concepts qualified for comparison, with scores ranging from 70.62 to 70.72. Mr. Rooter ranked highest at 70.72. Property replacement-cycle demand added 0.79 points on average among the affected concepts. Labor and staffing friction reduced the exposed concepts by 0.40 points on average.
Interpret cautiously: A 0.10-point spread is too small to support a strong brand-level conclusion from city alignment alone.
2 Property Restoration concepts qualified for comparison, with scores ranging from 68.66 to 69.62. PuroClean ranked highest at 69.62. Property replacement-cycle demand added 0.11 points on average among the affected concepts. Target-market demand reduced the exposed concepts by 0.70 points on average.
Interpret cautiously: A 0.96-point spread is too small to support a strong brand-level conclusion from city alignment alone.
Metric registry
The registry shows each public metric’s raw value, period, geography, source, and its actual role in the compiled analysis.
| Metric | Raw value | Period | Geography | Role in analysis | Source |
|---|---|---|---|---|---|
| Population growth since 2020 | 410,053 residents in 2025; +6.2% from the 2020 estimates base | 2020-2025 / 2022 / 2020-2024 | Aurora, Colorado | Used in scoring | [1] [2] |
| Population density | 2,412.2 people per square mile | 2020-2025 / 2022 / 2020-2024 | Aurora, Colorado | Context only | [1] |
| Household count | 145,310 households | 2020-2025 / 2022 / 2020-2024 | Aurora, Colorado | Context only | [1] |
| Owner-occupied housing share | 62.4% owner-occupied | 2020-2025 / 2022 / 2020-2024 | Aurora, Colorado | Used in scoring | [1] [2] |
| Renter-occupied housing share | 37.6% renter-occupied | 2020-2025 / 2022 / 2020-2024 | Aurora, Colorado | Context only | [1] [2] |
| Detached single-family housing share | 53.3% of housing units are 1-unit detached structures | 2020-2024 | Aurora, Colorado | Context only | [4] |
| Housing in buildings with two or more units | 34.0% of housing units are in buildings with two or more units | 2020-2024 | Aurora, Colorado | Context only | [5] |
| Median year structure built | Median year built: 1985 | 2020-2024 | Aurora, Colorado | Context only | [4] |
| Median owner-occupied home value | $469,100 median owner-occupied home value | 2020-2025 / 2022 / 2020-2024 | Aurora, Colorado | Context only | [1] [2] |
| Median household income | $88,368 median household income | 2020-2025 / 2022 / 2020-2024 | Aurora, Colorado | Context only | [1] [2] |
| Poverty share | 11.9% of persons in poverty | 2020-2025 / 2022 / 2020-2024 | Aurora, Colorado | Context only | [1] [2] |
| Moved since previous year | 15.6% moved since the previous year | 2024 | Aurora, Colorado | Used in scoring | [3] |
| Population under age 18 | 23.9% under age 18 | 2020-2025 / 2022 / 2020-2024 | Aurora, Colorado | Supports modeled relationship | [1] [2] |
| Population age 65 and older | 12.4% age 65 or older | 2020-2025 / 2022 / 2020-2024 | Aurora, Colorado | Context only | [1] [2] |
| Under-65 disability share | 8.6% of people under 65 report a disability | 2020-2025 / 2022 / 2020-2024 | Aurora, Colorado | Context only | [1] [2] |
| Under-65 uninsured share | 15.3% of people under 65 are uninsured | 2020-2025 / 2022 / 2020-2024 | Aurora, Colorado | Used in scoring | [1] [2] |
| Civilian labor-force participation rate | 71.3% labor-force participation among population age 16+ | 2020-2025 / 2022 / 2020-2024 | Aurora, Colorado | Context only | [1] [2] |
| Households with broadband subscription | 93.6% of households have broadband | 2020-2025 / 2022 / 2020-2024 | Aurora, Colorado | Context only | [1] [2] |
| Mean travel time to work | 28.6 minutes mean travel time to work | 2020-2025 / 2022 / 2020-2024 | Aurora, Colorado | Supports modeled relationship | [1] [2] |
| Retail sales per capita | $17,730 retail sales per capita | 2020-2025 / 2022 / 2020-2024 | Aurora, Colorado | Context only | [1] [2] |
| Accommodation and food-services sales | $1.459 billion accommodation and food-services sales | 2020-2025 / 2022 / 2020-2024 | Aurora, Colorado | Context only | [1] |
| Health care and social assistance receipts/revenue | $5.633 billion health care and social assistance receipts/revenue | 2020-2025 / 2022 / 2020-2024 | Aurora, Colorado | Supports modeled relationship | [1] |
| Food preparation and serving mean hourly wage | $21.46/hour vs $17.86 U.S. | May 2025 | Denver-Aurora-Centennial, Colorado metropolitan statistical area | Used in scoring | [6] |
| Mean hourly wage for building and grounds occupations | $21.87/hour vs $19.66 U.S. | May 2025 | Denver-Aurora-Centennial, Colorado metropolitan statistical area | Context only | [6] |
| Construction and extraction mean hourly wage | $33.00/hour vs $31.42 U.S. | May 2025 | Denver-Aurora-Centennial, Colorado metropolitan statistical area | Context only | [6] |
| Applicable statutory minimum wage | $15.16/hour Colorado minimum wage where no local minimum wage applies | 2026 | Colorado | Context only | [9] |
| Drinking-water hardness | Average hardness 136 mg/L as CaCO3 (range 87-198), within the USGS hard-water band at the average. | 2026 | Aurora Water service area | Used in scoring | [15] [16] |
How to use the ranking
Methodology
Collect reusable local metrics with source, period, geography, and confidence fields.
Map each franchise to controlled operating attributes and local sensitivities.
Apply fully supported relationships at full weight and otherwise scoreable research- or taxonomy-gated relationships at a reduced provisional weight.
Keep territory-, site-, customer-, project-, or configuration-dependent relationships outside the baseline score until the relevant candidate selections are known.
Remove one factor at a time from every concept and rerank using full-precision scores.
Create the ranking, factor-status ledger, visuals, metric registry, and automated quality report from the same data.
Every concept starts from the same 70.00 reference point, so differences come only from modeled local interactions. In Aurora, Pillar To Post Home Inspectors reached 70.998. Target-market demand netted to +1.19 points after 15.6% moved since the previous year moved since previous year was partly offset by 62.4% owner-occupied owner-occupied housing share. [3] [1] [2] Labor and staffing friction totaled -0.29 points, led by $21.46/hour vs $17.86 u.s. mean wage for food preparation and serving occupations at -0.29 points. [6] Property replacement-cycle demand totaled +0.11 points, led by average hardness 136 mg/l as caco3 (range 87-198), within the usgs hard-water band at the average. drinking-water hardness at +0.11 points. [15] [16]
The current model caps total local movement at ±18.00 points. The score is not a percentage, probability, or estimate of investment quality.
Score calibration
Each score-changing relationship starts with its model-defined maximum effect. The documented city-condition strength and the franchise's weighted operating exposure scale that maximum. Evidence confidence, provenance, geographic applicability, and the profile-confidence multiplier then modify the pre-cap effect. Fully supported relationships use full weight; broadly applicable relationships held back only by research or taxonomy-review gates use an additional 0.80 eligibility multiplier. Candidate-dependent site, territory, customer, project, or operating selections remain outside the baseline score until resolved. Correlation and score caps can reduce the resulting magnitude before the final contribution is added to the common baseline.
The model does not use one universal Minor/Moderate/Strong point table. Relationship-specific max_effect values are the actual point ceilings, so publishing generic point bands would misstate the scoring system.
“Best” means the strongest modeled local operating alignment among the franchise concepts assessed on this page.
Model governance
No concept’s final score is manually raised or lowered after calculation. Reports are checked for source scope, classification, arithmetic, unsupported claims, duplication, and readability before publication.
Model updates are versioned and dated, documenting material changes to scoring, evidence handling, methodology, governance, and presentation across published reports.
Corrected source, geography, or operating-profile evidence triggers a full compiler rerun so every dependent score and visual is recalculated.
Source registry
The city page keeps the local sources used for its visible findings and metrics. Franchise-source provenance stays with the underlying franchise research rather than being duplicated across every city page.
Used for: Population growth since 2020, Population density, Household count, Owner-occupied housing share, and Renter-occupied housing share
Used for: Population growth since 2020, Owner-occupied housing share, Renter-occupied housing share, Median owner-occupied home value, and Median household income
Used for: Moved since previous year
Used for: Detached single-family housing share and Median year structure built
Used for: Housing in buildings with two or more units
Used for: Food preparation and serving mean hourly wage, Mean hourly wage for building and grounds occupations, and Construction and extraction mean hourly wage
Used for: Applicable statutory minimum wage
Used for: Drinking-water hardness
Used for: Drinking-water hardness
Before contacting a franchisor
Apply the analysis to your situation
The city score does not include your experience, capital structure, time commitment, financing, or exact territory.
Twenty Twenty-Five