
69.7 average across 2 concepts
Local operating-model alignment analysis
Best Franchise Opportunities We Assessed in Fort Worth, Texas
We compared 14 franchise concepts for Fort Worth, Texas. Healthcare institutional service demand was a leading positive mechanism. Territory and submarket uncertainty was a leading operating constraint.
What “best” means in this ranking“Best” means the strongest modeled local operating alignment among the franchise concepts assessed on this page. It does not estimate earnings or determine which franchise is best for a particular candidate.
14Concepts evaluated
30Sources used
20Primary sources
21Local metrics
Evaluation set
Why these concepts were evaluated
This is not a ranking of every franchise that may be offered in the city.
14Concepts assessed
Concepts were included when enough operating-model information existed to assign a provisional local-sensitivity profile. Unresolved inputs reduce confidence or remain conditional rather than automatically excluding a concept.
A brand’s participation in our referral network does not add points or change its position.
City-level conclusions
What stood out in our assessment
0.2 points average among 6 affected concepts
0.3 points average reduction among 14 affected concepts
Tested rank range spans 10 positions
Executive conclusion
What the ranking means for Fort Worth, Texas
City Wide, Jan-Pro International, and ActionCOACH produced the highest modeled local-alignment scores in the evaluated set. Healthcare institutional service demand was the strongest positive scored mechanism among 6 exposed concepts, adding 0.2 points on average. Territory and submarket uncertainty was the broadest operating constraint, reducing exposed concepts by 0.3 points on average. These scores describe local operating alignment, not expected returns or overall franchise quality; the offered territory and franchise economics still require separate diligence.
How this differs from a directory: the model does not award points for brand popularity, advertising placement, or referral compensation. It tests how documented local conditions interact with each concept’s operating requirements.
Best franchise opportunities assessed
Top 10 local-alignment scores from 14 concepts assessed
“Best” refers to modeled local operating alignment among the concepts assessed—not expected earnings, franchise-system quality, or candidate fit.
Rankings use full-precision scores.Displayed values use one decimal place. Identical displayed scores can therefore have different ranks, and close results should be treated as effectively similar.
| Rank | Franchise | Alignment and tier | Largest advantage | Largest constraint | Evidence confidence |
|---|---|---|---|---|---|
| 1 | City WideFacility managementInvestment: $229,729–$410,730 | 70.4Tier 3 · Mixed modeled alignment | +0.4 ptsTarget-market demand | -0.1 ptsTerritory quality | Moderate evidence confidence |
| 2 | Jan-Pro InternationalCommercial cleaningInvestment: $130,000–$421,500 | 70.1Tier 3 · Mixed modeled alignment | +0.3 ptsTarget-market demand | -0.3 ptsTerritory quality | Moderate evidence confidence |
| 3 | ActionCOACHBusiness coachingInvestment: $71,668–$303,513 | 70.0Tier 3 · Mixed modeled alignment | +0.1 ptsTarget-market demand | -0.1 ptsTerritory quality | Moderate evidence confidence |
| 4 | HomeSmilesProperty maintenance servicesInvestment: $148,110–$201,800 | 69.8Tier 3 · Mixed modeled alignment | +0.2 ptsTarget-market demand | -0.3 ptsTerritory quality | Moderate evidence confidence |
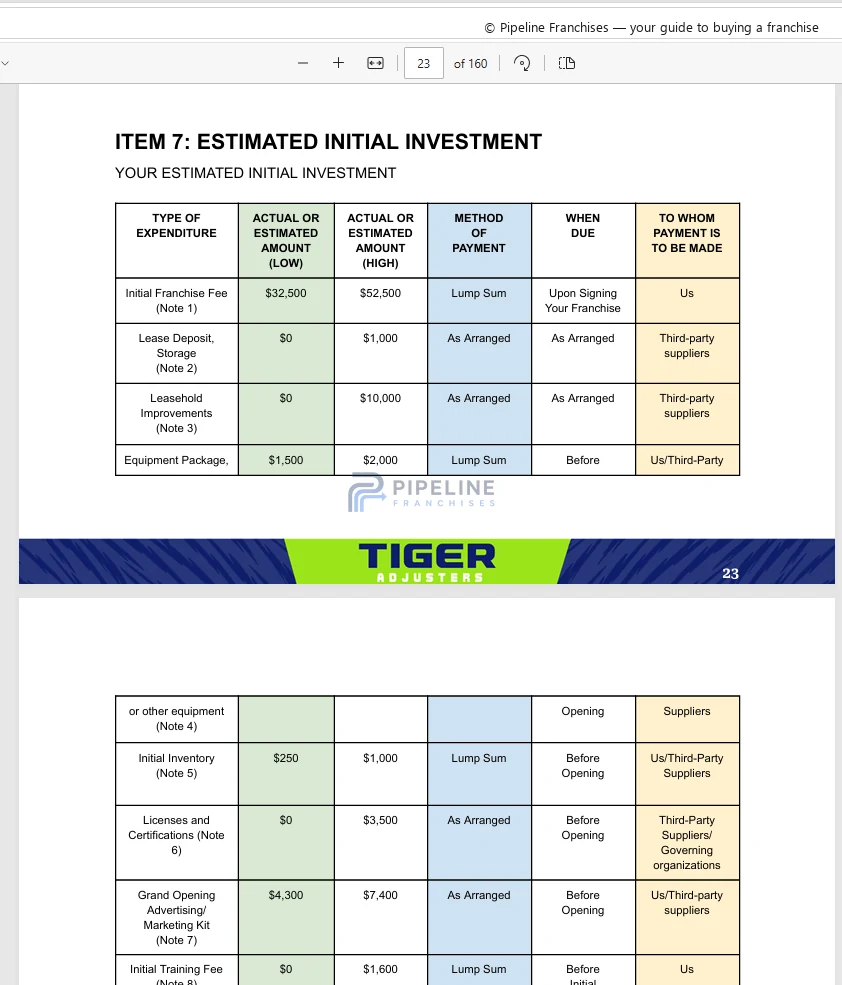
| 5 | Tiger AdjustersPublic insurance adjustingInvestment: $43,050–$159,500 | 69.8Tier 3 · Mixed modeled alignment | No material positive local adjustment | -0.2 ptsTerritory quality | Moderate evidence confidence |
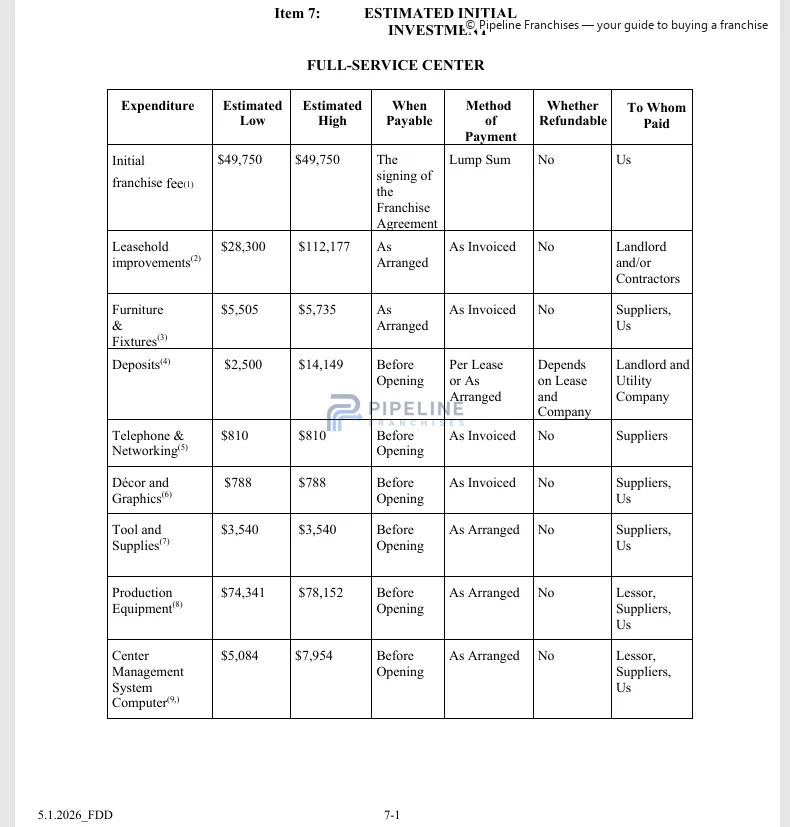
| 6 | FASTSIGNSSigns and graphicsInvestment: $231,226–$386,285 | 69.8Tier 3 · Mixed modeled alignment | +0.2 ptsTarget-market demand | -0.4 ptsTerritory quality | Moderate evidence confidence |
| 7 | Pillar To Post Home InspectorsHome inspectionInvestment: $102,690–$134,290 | 69.7Tier 3 · Mixed modeled alignment | No material positive local adjustment | -0.3 ptsTerritory quality | Moderate evidence confidence |
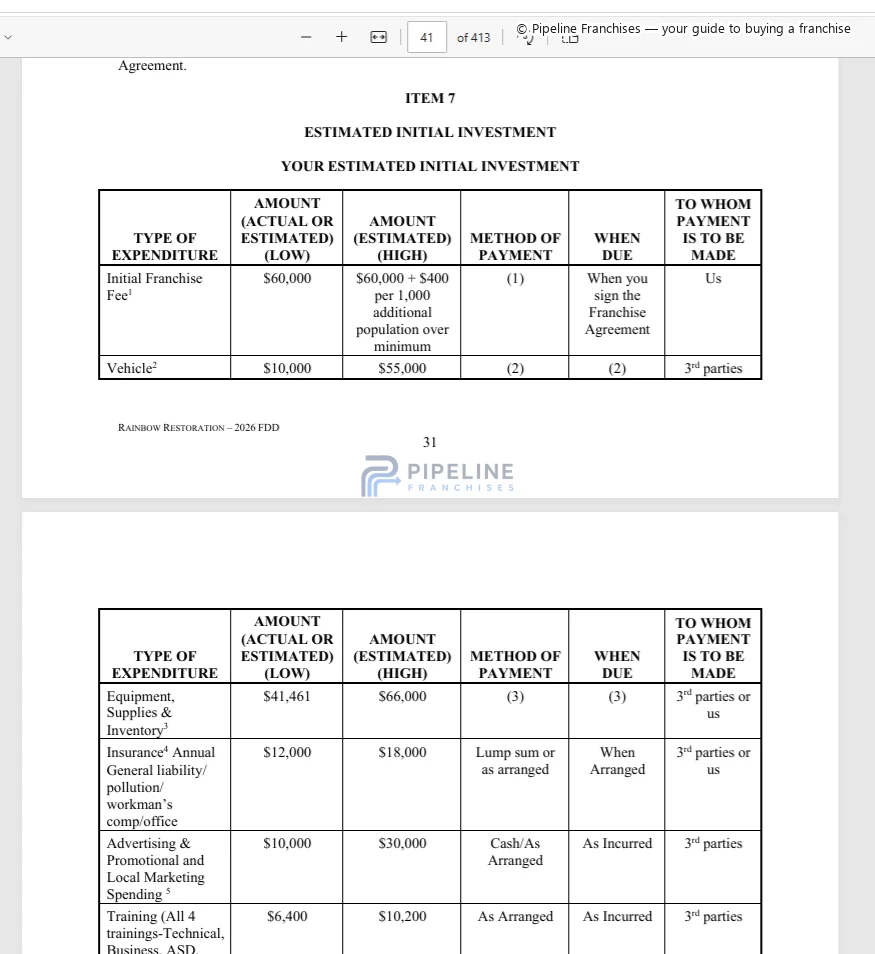
| 8 | Rainbow International RestorationRestorationInvestment: $185,336–$351,900 | 69.7Tier 3 · Mixed modeled alignment | +0.1 ptsTarget-market demand | -0.4 ptsTerritory quality | Moderate evidence confidence |
| 9 | Aire ServHVAC installation, repair, and maintenanceInvestment: $113,308–$271,708 | 69.7Tier 3 · Mixed modeled alignment | No material positive local adjustment | -0.3 ptsTerritory quality | Moderate evidence confidence |
| 10 | Mister Sparky ElectricElectrical | 69.6Tier 3 · Mixed modeled alignment | No material positive local adjustment | -0.4 ptsTerritory quality | Moderate evidence confidence |
Conditions that changed the analysis
What mattered most in Fort Worth, Texas
Near Southside / Medical District concentrates a material healthcare employment and institutional-service node
This relationship affected 6 concepts and added 0.2 points on average among those exposed. Local evidence: Fort Worth TIF 4 Southside / Medical District scale and 2024 taxable value: acres: 1,278; base value usd: 229,759,626; taxable value 2024 usd: 1,658,917,576; reported percent growth: 669 mixed district metrics. [28] [27]
Fort Worth demand and employment are distributed across materially different operating nodes
This relationship affected 14 concepts and reduced 0.3 points on average among those exposed. Local evidence: Fort Worth grew 11.9 percent from 2020 to 2025 and ranked 23rd in population density among the 30 most populous U.S. cities: population change 2020 2025 percent: 11.9; density rank among top 30 cities: 23 mixed population metrics. [8] [7] [27]
Fort Worth had 1,028,117 residents in 2025 and grew 11.9 percent from 2020 to 2025
Rapid resident growth expands the broad household base, but the City also ranks 23rd in density among the 30 most populous U.S. cities and Fort Worth contains large, geographically distinct employment nodes such as AllianceTexas and the Near Southside / Medical District. Population growth therefore should not be interpreted as uniform walk-in density, uniform daytime demand, or interchangeable service territories. [7] [8] [25] [27]
Evidence behind the city mechanisms
Near Southside / Medical District concentrates a material healthcare employment and institutional-service node1 modeled effect
Healthcare institutional service demandTarget-market demand
Active Fort Worth roadway restrictions create temporary route-specific disruption1 modeled effect
Temporary route disruptionTransportation, routing, and parking
Fort Worth demand and employment are distributed across materially different operating nodes1 modeled effect
Territory and submarket uncertaintyTerritory quality
Urban-design and historic overlays can require pre-permit review of exterior prototype elements1 modeled effect
Signage and prototype adaptation burdenRegulatory and operating friction
Compare all assessed concepts
Local impact by franchise concept
14 concepts shown. Expand a concept to see the score-changing factors and their modeled drivers; the full audit ledger stays collapsed.
#1Tier 3 · Mixed modeled alignment70.4
City Wide
Initial investment: $229,729–$410,730
Increase +0.4 pts Target-market demandReduction -0.1 pts Territory quality
Rank sensitivity: Stable
Why it ranks here
Score-changing local factors only. Evidence links open the underlying city finding.
| Local factor | Modeled drivers | Impact |
|---|---|---|
| Target-market demand |
| +0.4 pts |
| Territory quality |
| -0.1 pts |
| Net local movement | +0.40 pts | |
Net uses full-precision effects; displayed factor and driver rows are rounded.
Franchise evidence
Source material assessed
Item 3 — Litigation
1 image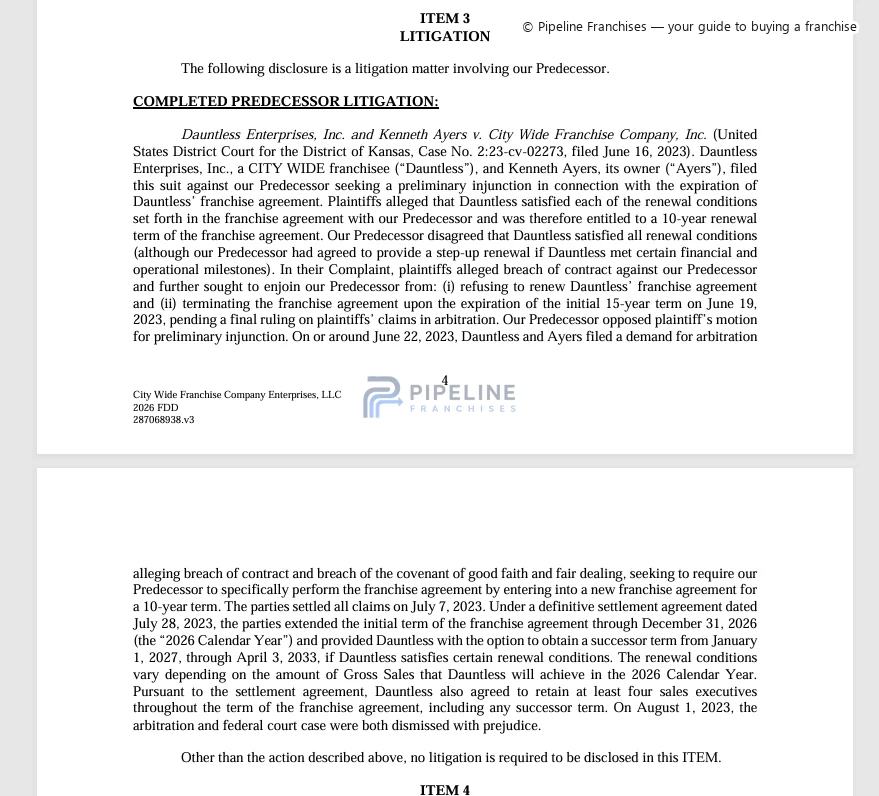
Item 6 — Other Fees
1 image
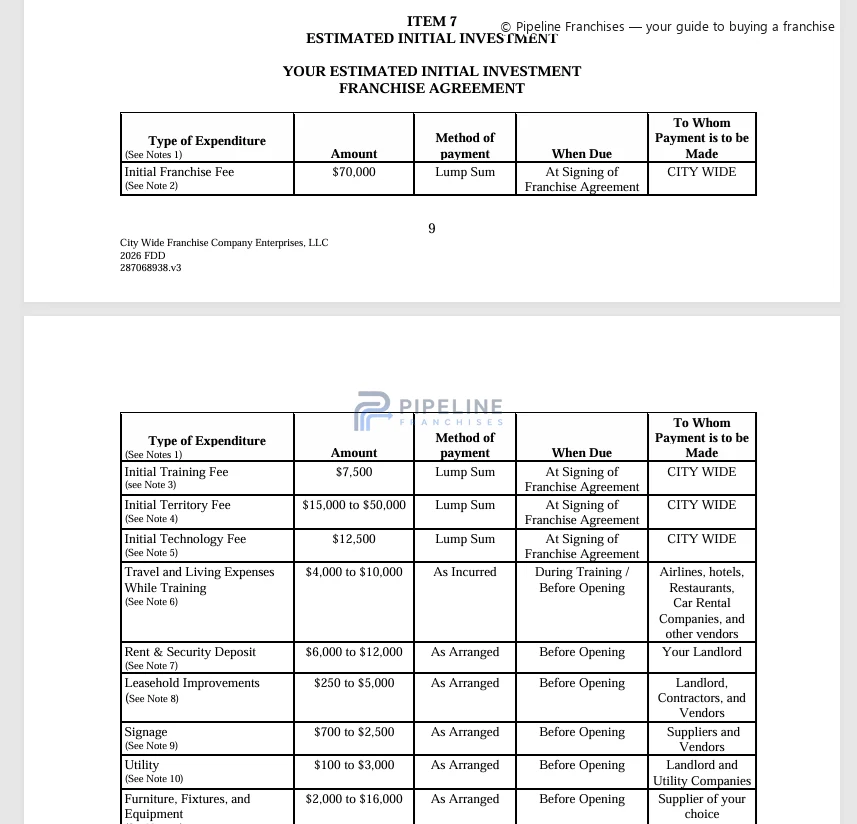
Item 7 — Estimated Initial Investment
2 images
Item 12 — Territory
1 image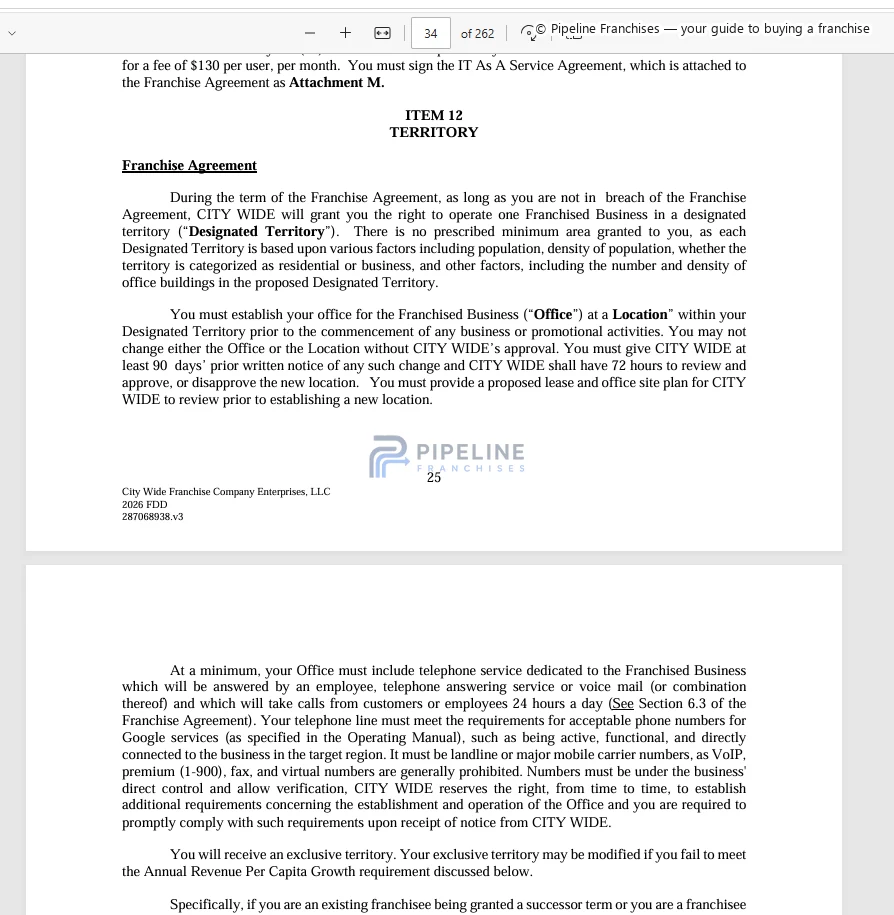
Item 20 — Outlets and Franchise Information
1 image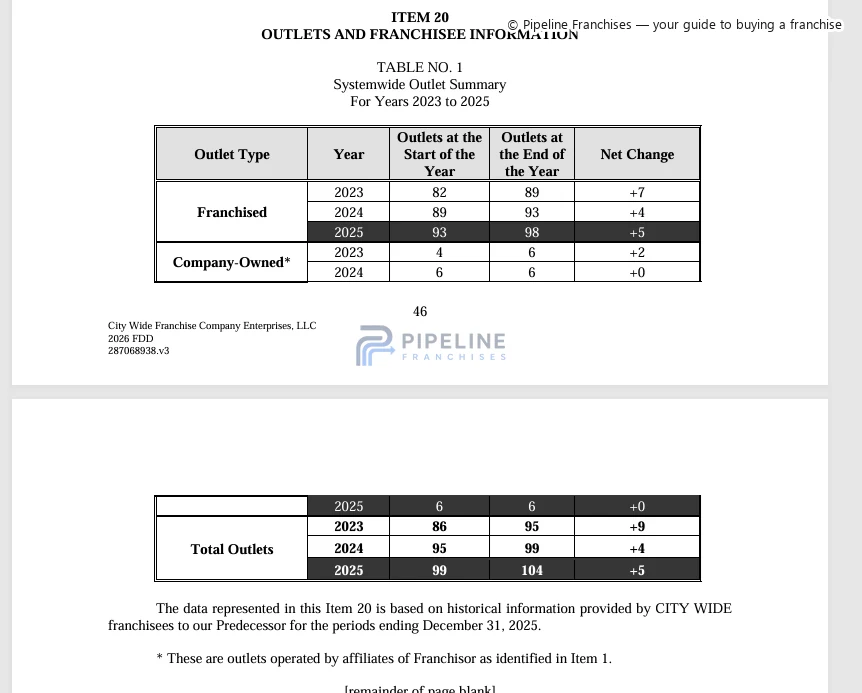
Full calculation and evidence confidence
Audit layer
Full factor ledger
Full score ledger
Every factor is classified so a displayed zero is not mistaken for a score-changing effect.
| Neutral model baseline | 70.0 |
|---|---|
| Target-market demand | +0.4 |
| Property replacement-cycle demand | Depends on the specific site, territory, or operating condition |
| Competitive environment | Not included in the score |
| Labor and staffing friction | Measured; no meaningful local adjustment |
| Transportation, routing, and parking | Depends on the specific site, territory, or operating condition |
| Real estate and site feasibility | Not included in the score |
| Sales and customer acquisition | Not included in the score |
| Referral ecosystem | Not included in the score |
| Territory quality | -0.1 |
| Regulatory and operating friction | Depends on the specific site, territory, or operating condition |
| Full-precision calculated score | 70.40 |
| Published local-market alignment | 70.4 |
Factor calculations use full precision. Contributions and published scores are displayed to one decimal place; ranking order uses the full-precision score.
Evidence confidence
- City Modifier Evidence
- Strong
- Factor Research Coverage
- Adequate
- Franchise-profile completeness
- Limited
- Source-evidence confidence
- Adequate
- Geographic applicability
- Limited
- Overall evidence confidence
- Moderate evidence confidence
- Largest absolute effect
- Target-market demand +0.4 pts
- Tested rank range
- #1–#1
#2Tier 3 · Mixed modeled alignment70.1
Jan-Pro International
Initial investment: $130,000–$421,500
Increase +0.3 pts Target-market demandReduction -0.3 pts Territory quality
Rank sensitivity: Moderately sensitive
Why it ranks here
Score-changing local factors only. Evidence links open the underlying city finding.
| Local factor | Modeled drivers | Impact |
|---|---|---|
| Target-market demand |
| +0.3 pts |
| Territory quality |
| -0.3 pts |
| Net local movement | +0.07 pts | |
Net uses full-precision effects; displayed factor and driver rows are rounded.
Franchise evidence
Source material assessed
Item 3 — Litigation
1 image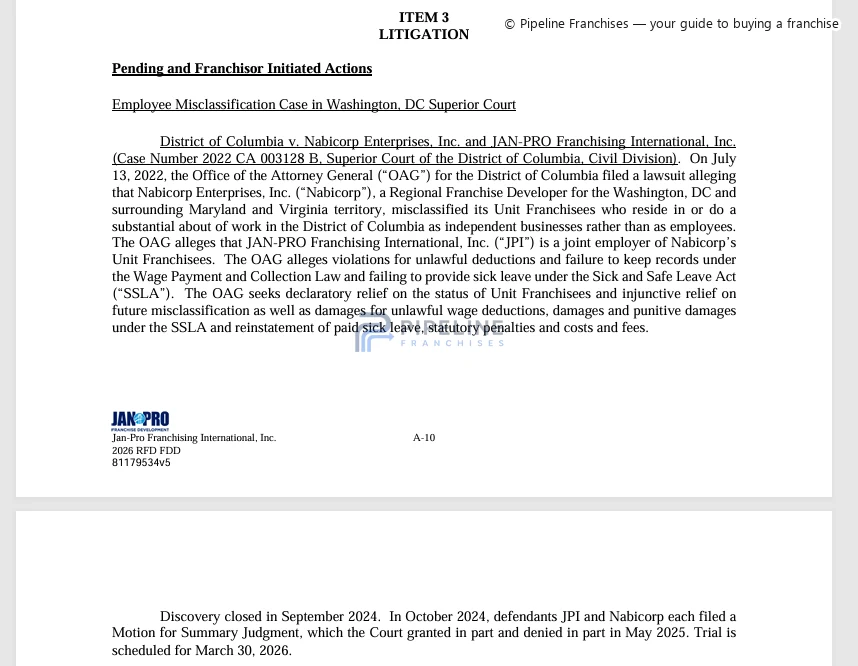
Item 6 — Other Fees
1 image
Item 7 — Estimated Initial Investment
1 image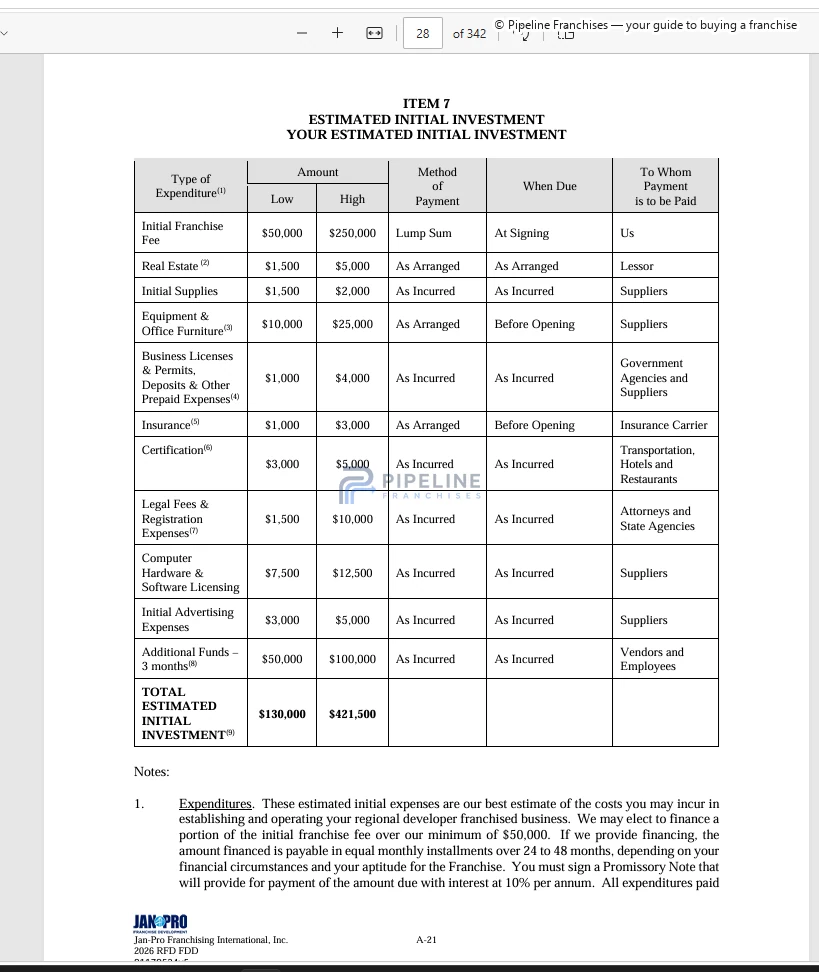
Item 12 — Territory
1 image
Item 20 — Outlets and Franchise Information
1 image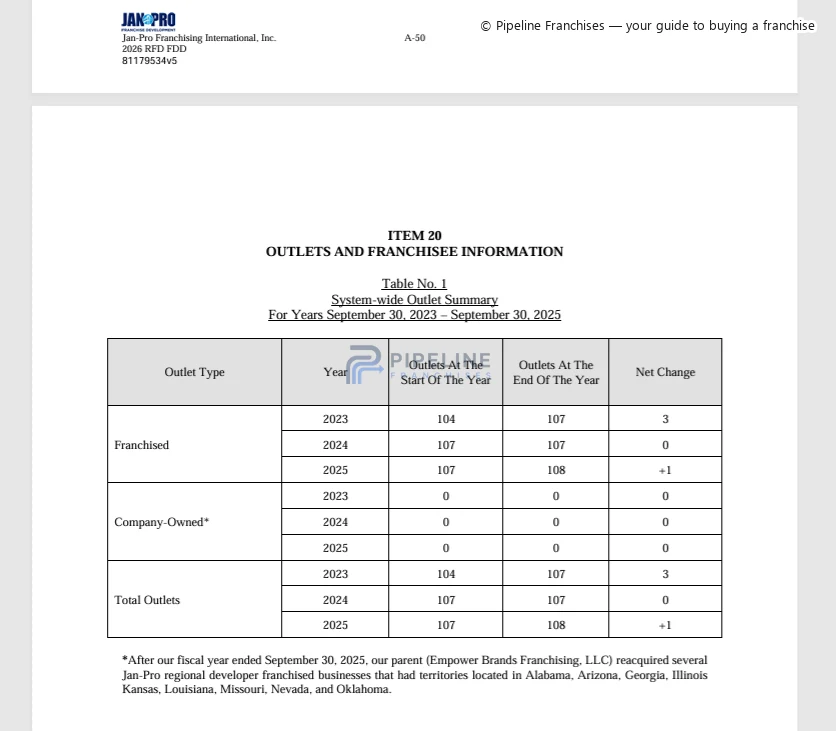
Full calculation and evidence confidence
Audit layer
Full factor ledger
Full score ledger
Every factor is classified so a displayed zero is not mistaken for a score-changing effect.
| Neutral model baseline | 70.0 |
|---|---|
| Target-market demand | +0.3 |
| Property replacement-cycle demand | Depends on the specific site, territory, or operating condition |
| Competitive environment | Not included in the score |
| Labor and staffing friction | Measured; no meaningful local adjustment |
| Transportation, routing, and parking | Depends on the specific site, territory, or operating condition |
| Real estate and site feasibility | Not included in the score |
| Sales and customer acquisition | Not included in the score |
| Referral ecosystem | Not included in the score |
| Territory quality | -0.3 |
| Regulatory and operating friction | Depends on the specific site, territory, or operating condition |
| Full-precision calculated score | 70.07 |
| Published local-market alignment | 70.1 |
Factor calculations use full precision. Contributions and published scores are displayed to one decimal place; ranking order uses the full-precision score.
Evidence confidence
- City Modifier Evidence
- Strong
- Factor Research Coverage
- Adequate
- Franchise-profile completeness
- Limited
- Source-evidence confidence
- Adequate
- Geographic applicability
- Limited
- Overall evidence confidence
- Moderate evidence confidence
- Largest absolute effect
- Target-market demand +0.3 pts
- Tested rank range
- #2–#4
#3Tier 3 · Mixed modeled alignment70.0
ActionCOACH
Initial investment: $71,668–$303,513
Increase +0.1 pts Target-market demandReduction -0.1 pts Territory quality
Rank sensitivity: Highly sensitive
Why it ranks here
Score-changing local factors only. Evidence links open the underlying city finding.
| Local factor | Modeled drivers | Impact |
|---|---|---|
| Territory quality |
| -0.1 pts |
| Target-market demand |
| +0.1 pts |
| Net local movement | -0.04 pts | |
Net uses full-precision effects; displayed factor and driver rows are rounded.
Franchise evidence
Source material assessed
Item 3 — Litigation
1 image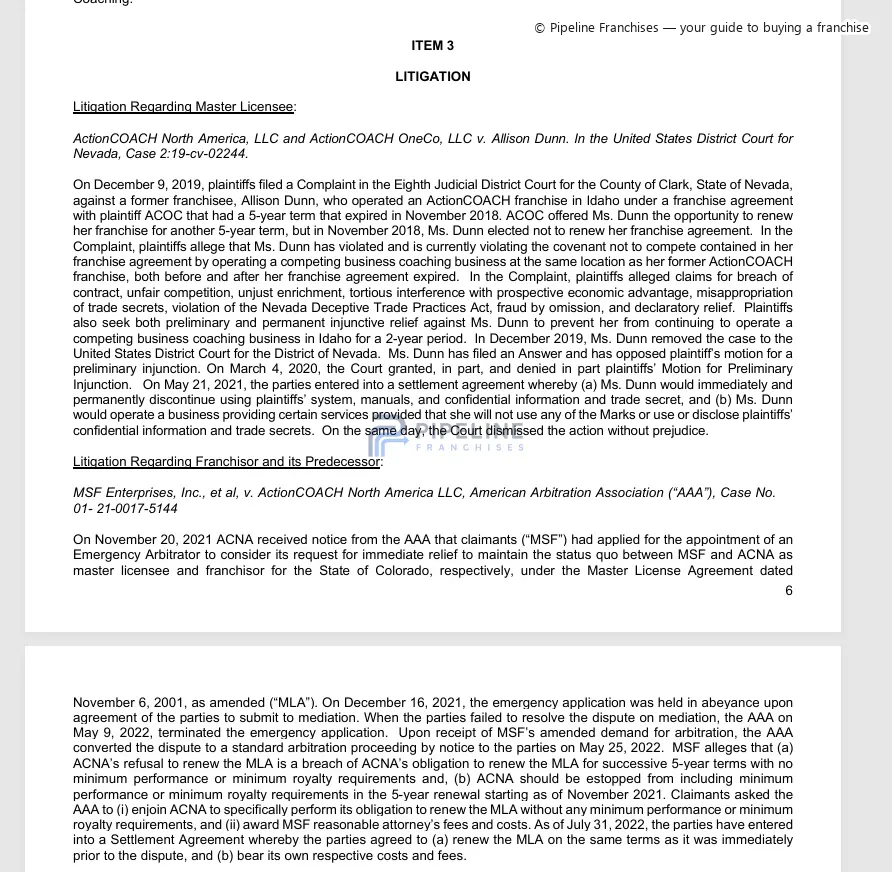
Item 6 — Other Fees
1 image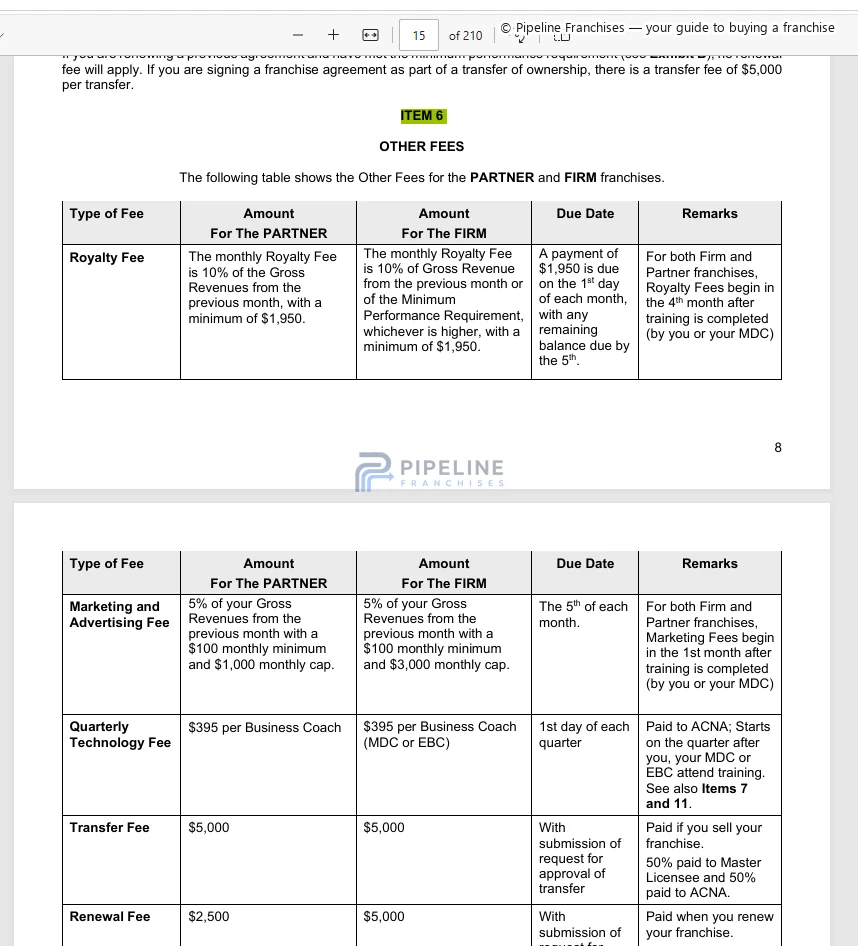
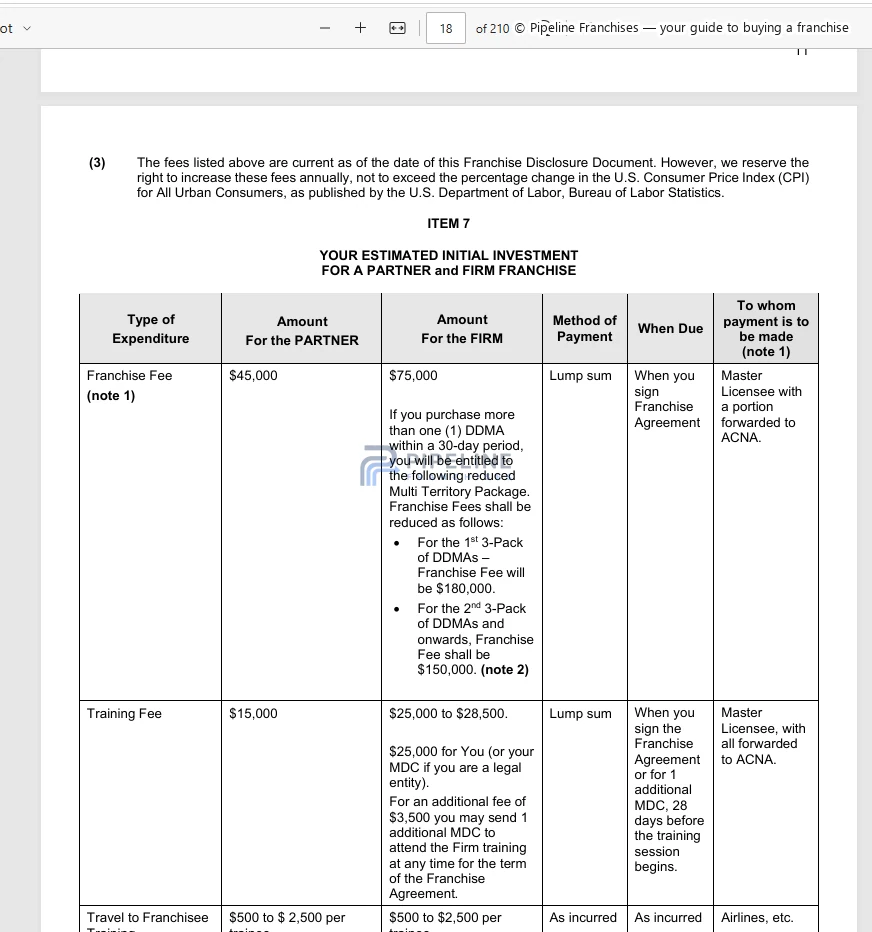
Item 7 — Estimated Initial Investment
2 images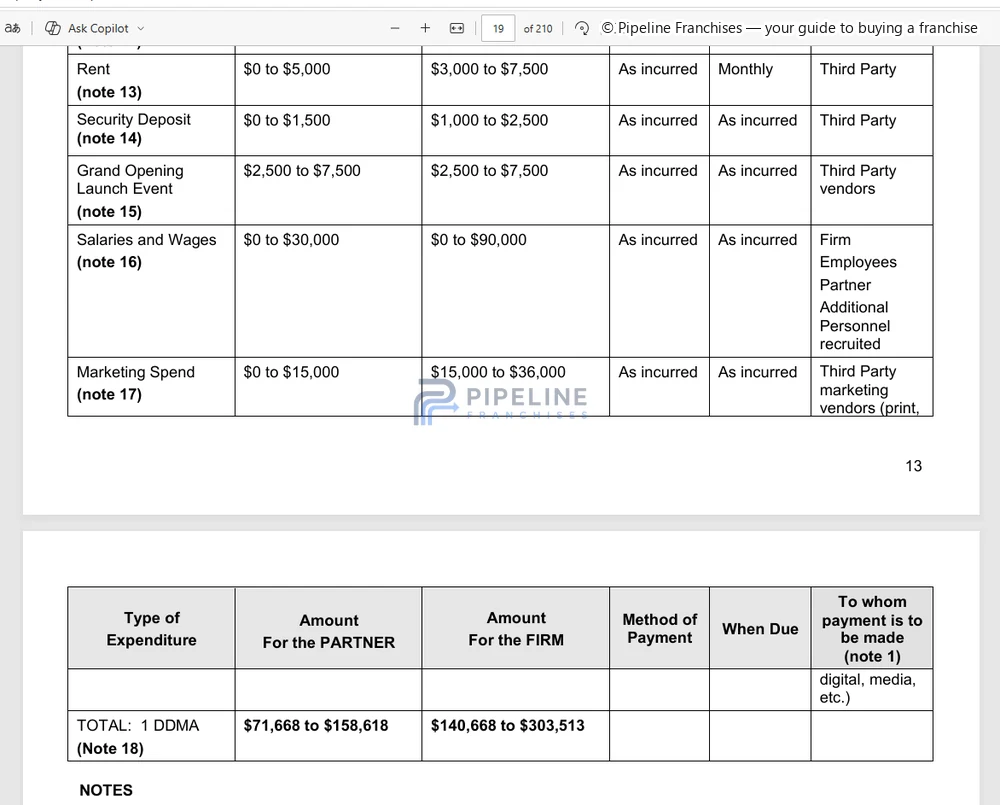
Item 12 — Territory
1 image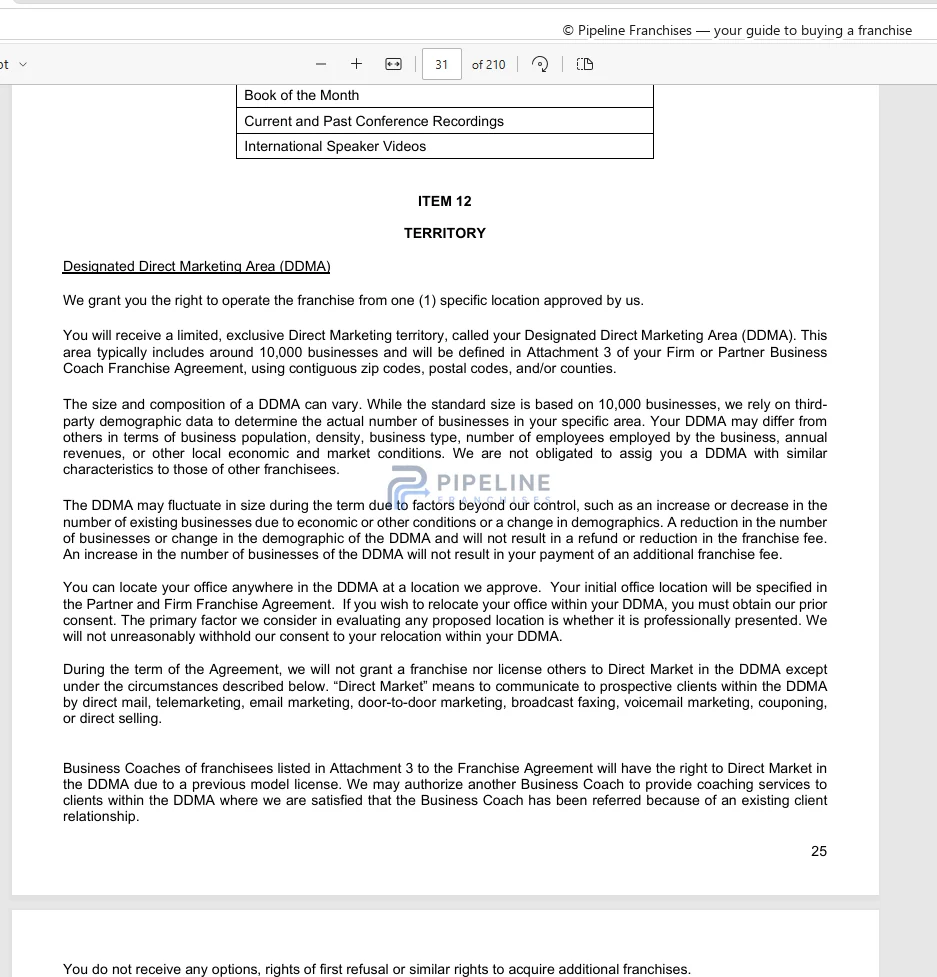
Item 20 — Outlets and Franchise Information
1 image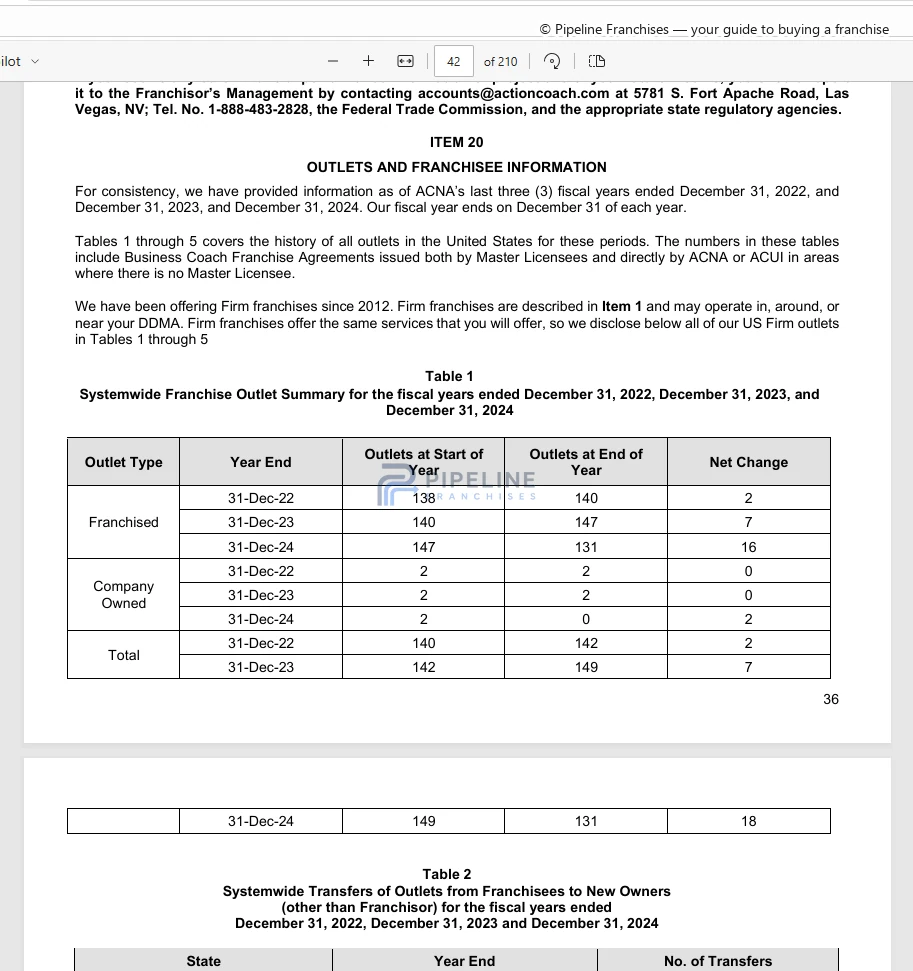
Full calculation and evidence confidence
Audit layer
Full factor ledger
Full score ledger
Every factor is classified so a displayed zero is not mistaken for a score-changing effect.
| Neutral model baseline | 70.0 |
|---|---|
| Target-market demand | +0.1 |
| Property replacement-cycle demand | Depends on the specific site, territory, or operating condition |
| Competitive environment | Not included in the score |
| Labor and staffing friction | Measured; no meaningful local adjustment |
| Transportation, routing, and parking | Depends on the specific site, territory, or operating condition |
| Real estate and site feasibility | Not included in the score |
| Sales and customer acquisition | Not included in the score |
| Referral ecosystem | Not included in the score |
| Territory quality | -0.1 |
| Regulatory and operating friction | Depends on the specific site, territory, or operating condition |
| Full-precision calculated score | 69.96 |
| Published local-market alignment | 70.0 |
Factor calculations use full precision. Contributions and published scores are displayed to one decimal place; ranking order uses the full-precision score.
Evidence confidence
- City Modifier Evidence
- Strong
- Factor Research Coverage
- Adequate
- Franchise-profile completeness
- Limited
- Source-evidence confidence
- Adequate
- Geographic applicability
- Limited
- Overall evidence confidence
- Moderate evidence confidence
- Largest absolute effect
- Territory quality -0.1 pts
- Tested rank range
- #2–#6
#4Tier 3 · Mixed modeled alignment69.8
HomeSmiles
Initial investment: $148,110–$201,800
Increase +0.2 pts Target-market demandReduction -0.3 pts Territory quality
Rank sensitivity: Moderately sensitive
Why it ranks here
Score-changing local factors only. Evidence links open the underlying city finding.
| Local factor | Modeled drivers | Impact |
|---|---|---|
| Territory quality |
| -0.3 pts |
| Target-market demand |
| +0.2 pts |
| Net local movement | -0.18 pts | |
Net uses full-precision effects; displayed factor and driver rows are rounded.
Franchise evidence
Source material assessed
Item 3 — Litigation
1 image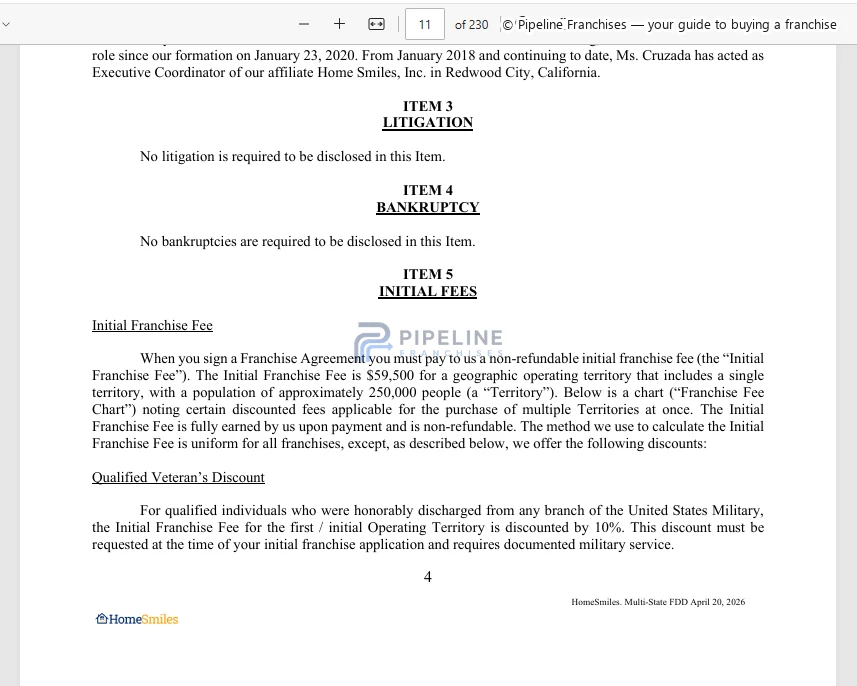
Item 6 — Other Fees
1 image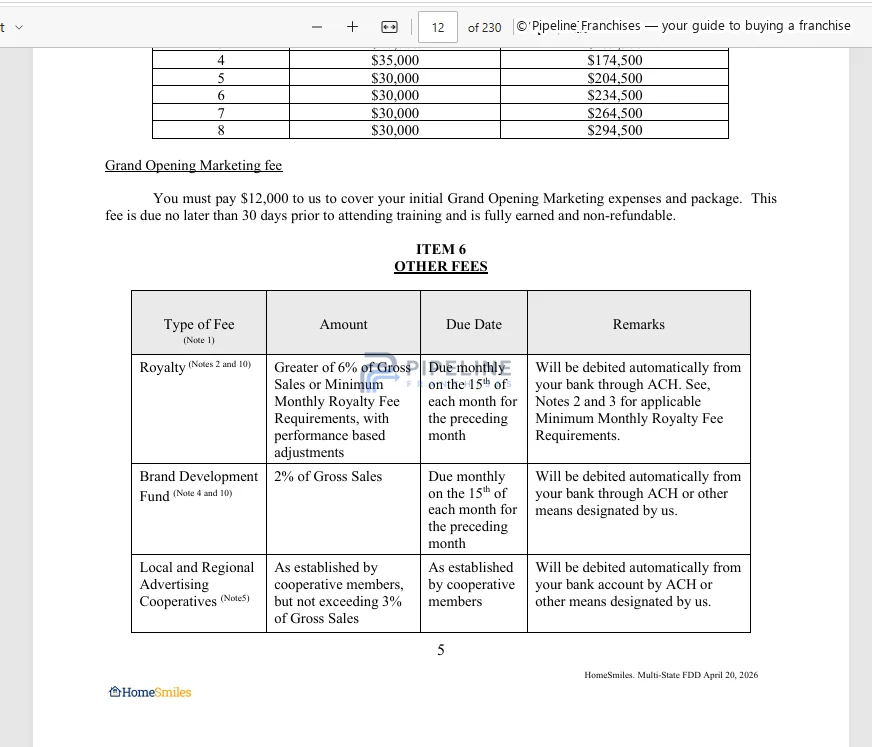
Item 7 — Estimated Initial Investment
2 images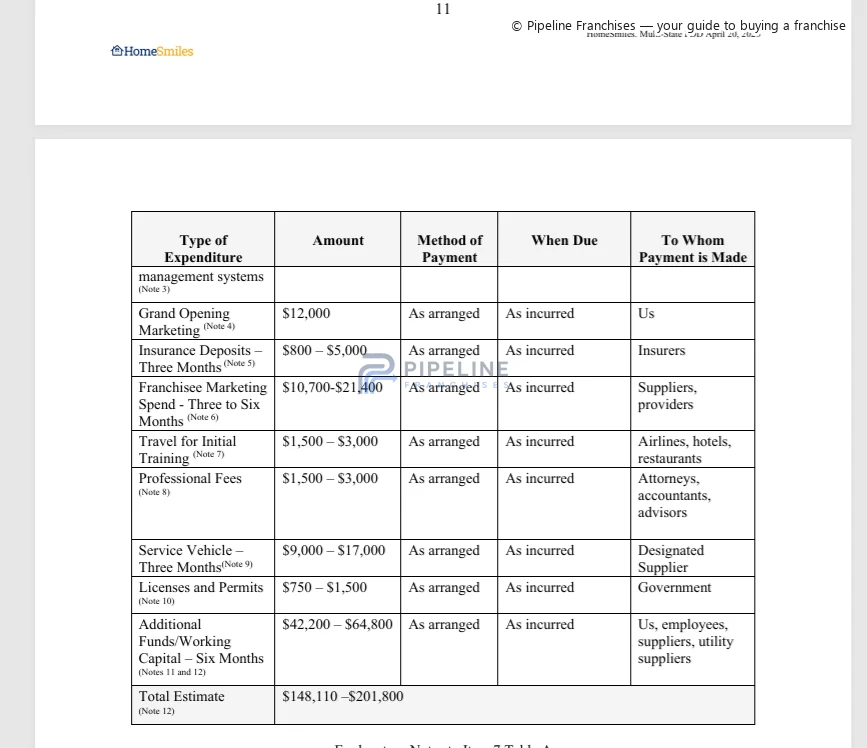
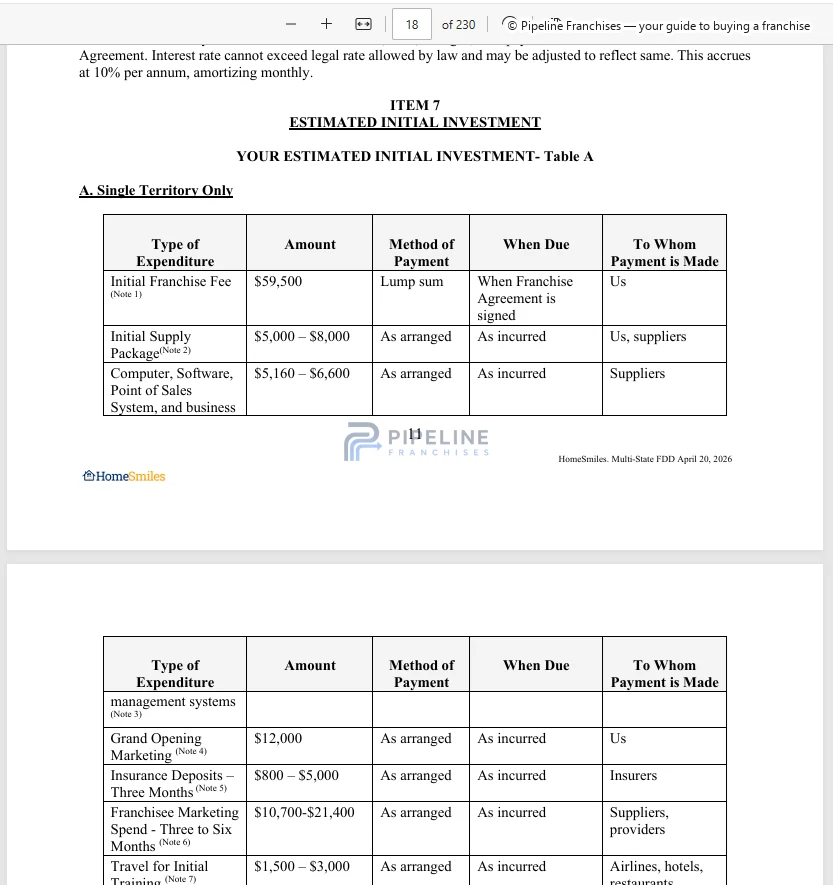
Item 12 — Territory
1 image
Item 20 — Outlets and Franchise Information
1 image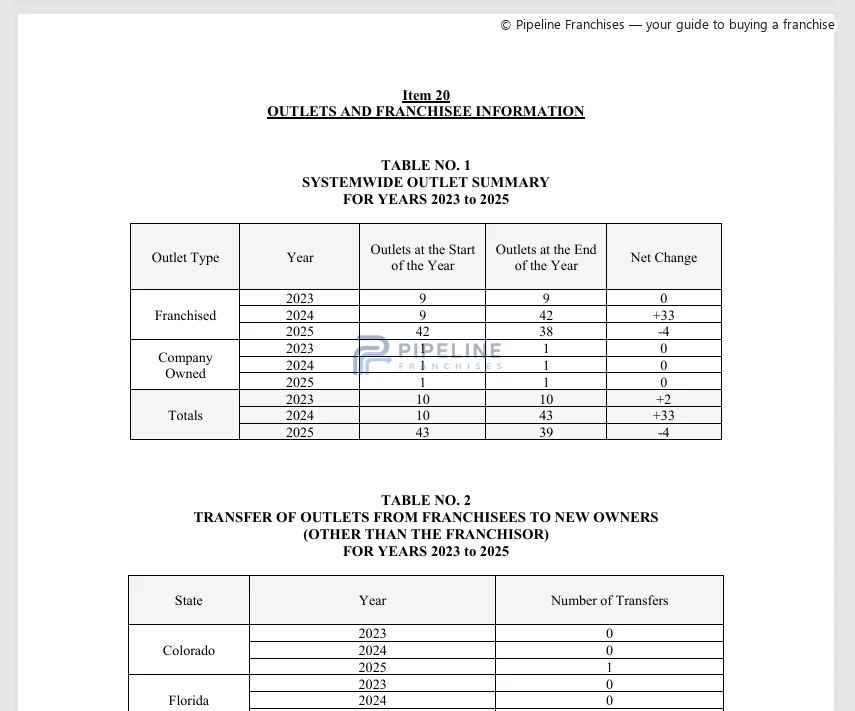
Full calculation and evidence confidence
Audit layer
Full factor ledger
Full score ledger
Every factor is classified so a displayed zero is not mistaken for a score-changing effect.
| Neutral model baseline | 70.0 |
|---|---|
| Target-market demand | +0.2 |
| Property replacement-cycle demand | Depends on the specific site, territory, or operating condition |
| Competitive environment | Not included in the score |
| Labor and staffing friction | Measured; no meaningful local adjustment |
| Transportation, routing, and parking | Depends on the specific site, territory, or operating condition |
| Real estate and site feasibility | Not included in the score |
| Sales and customer acquisition | Not included in the score |
| Referral ecosystem | Not included in the score |
| Territory quality | -0.3 |
| Regulatory and operating friction | Depends on the specific site, territory, or operating condition |
| Full-precision calculated score | 69.82 |
| Published local-market alignment | 69.8 |
Factor calculations use full precision. Contributions and published scores are displayed to one decimal place; ranking order uses the full-precision score.
Evidence confidence
- City Modifier Evidence
- Strong
- Factor Research Coverage
- Adequate
- Franchise-profile completeness
- Adequate
- Source-evidence confidence
- Adequate
- Geographic applicability
- Limited
- Overall evidence confidence
- Moderate evidence confidence
- Largest absolute effect
- Territory quality -0.3 pts
- Tested rank range
- #4–#7
#5Tier 3 · Mixed modeled alignment69.8
Tiger Adjusters
Initial investment: $43,050–$159,500
No material positive local adjustment identifiedReduction -0.2 pts Territory quality
Rank sensitivity: Highly sensitive
Why it ranks here
Score-changing local factors only. Evidence links open the underlying city finding.
| Local factor | Modeled drivers | Impact |
|---|---|---|
| Territory quality |
| -0.2 pts |
| Net local movement | -0.21 pts | |
Net uses full-precision effects; displayed factor and driver rows are rounded.
Franchise evidence
Source material assessed
Item 3 — Litigation
1 image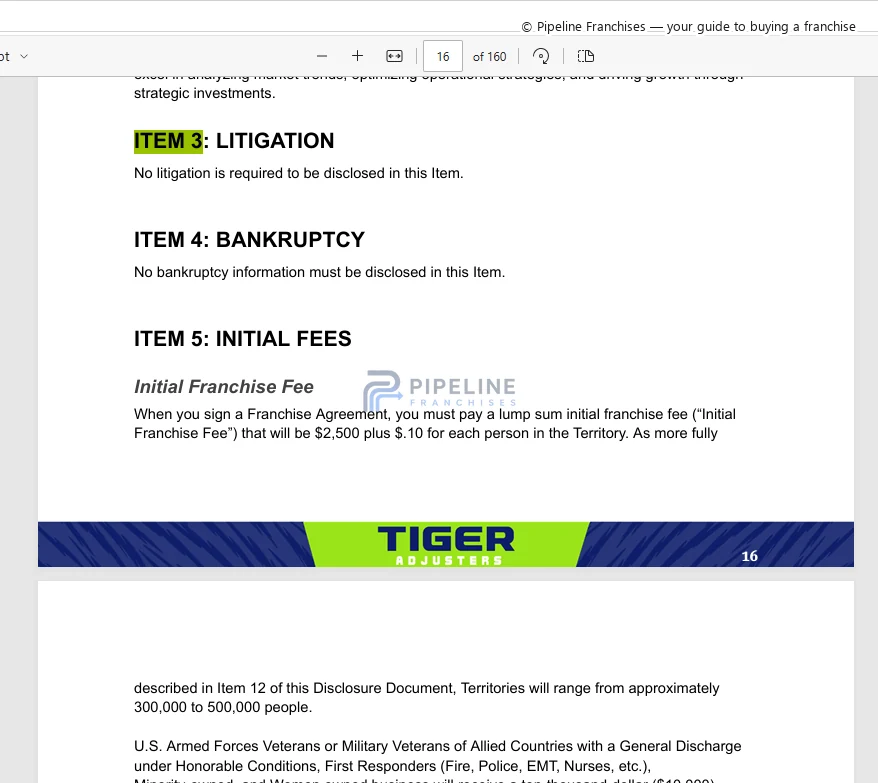
Item 6 — Other Fees
1 image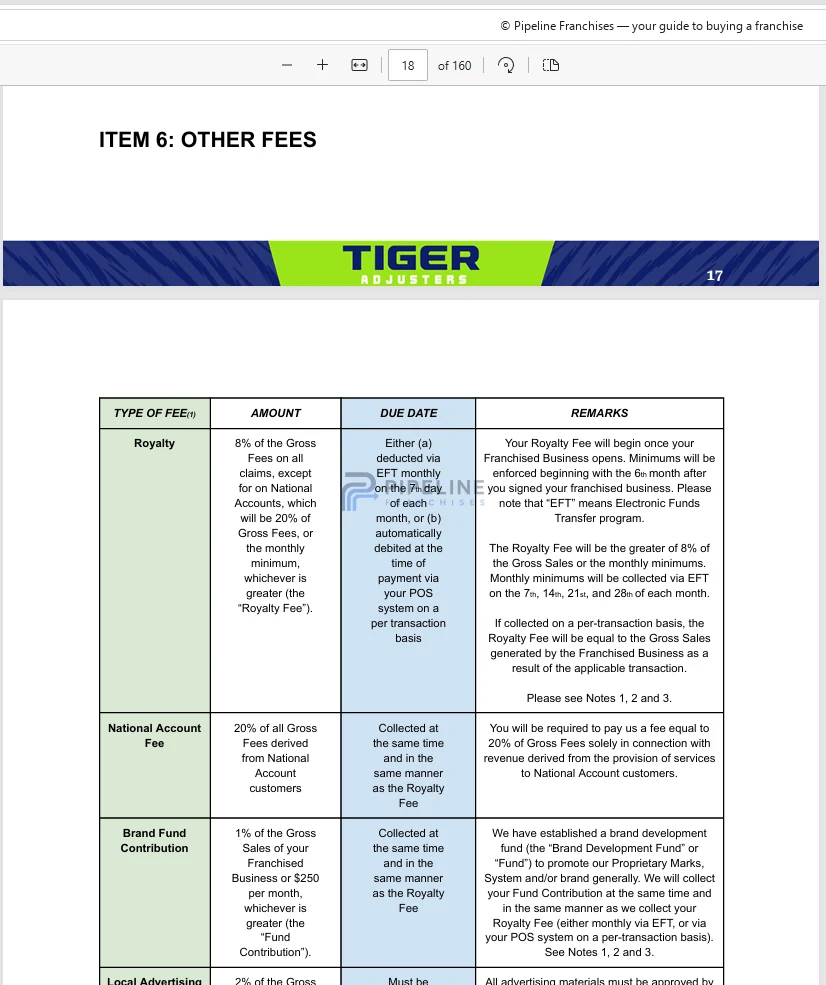
Item 7 — Estimated Initial Investment
2 images
Item 12 — Territory
1 image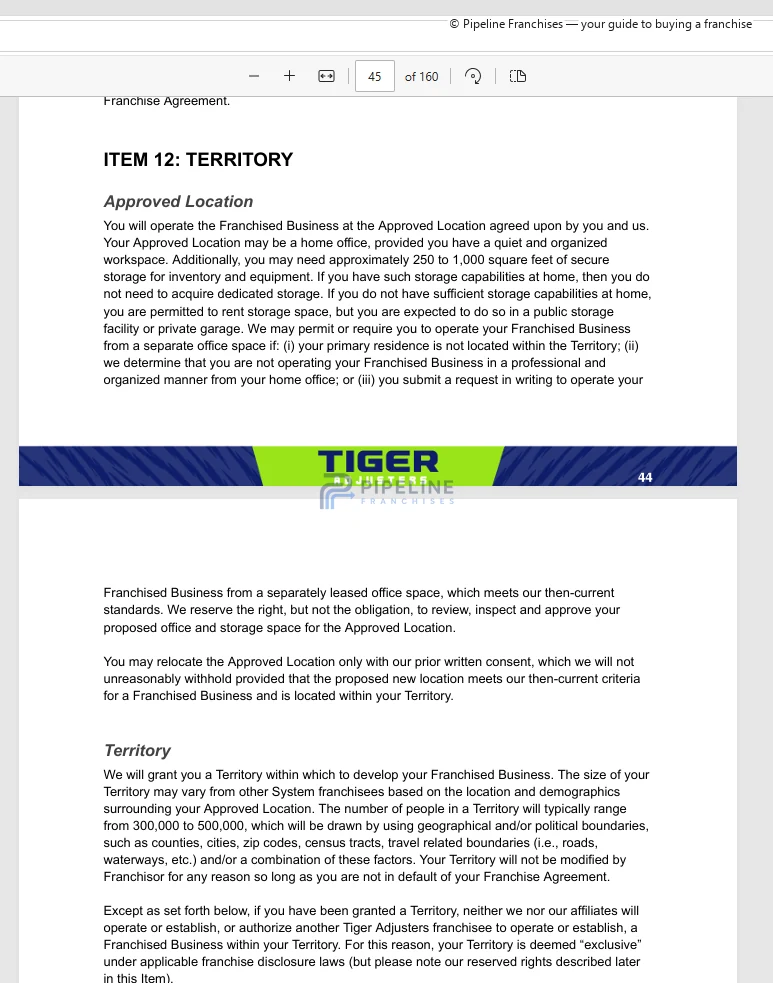
Item 19 — Financial Performance Representation
1 image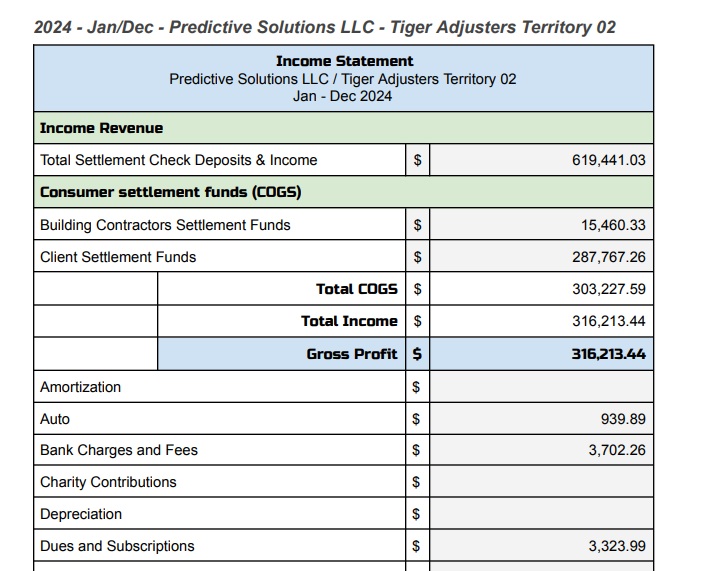
Public company data assessed
1 sourceFull calculation and evidence confidence
Audit layer
Full factor ledger
Full score ledger
Every factor is classified so a displayed zero is not mistaken for a score-changing effect.
| Neutral model baseline | 70.0 |
|---|---|
| Target-market demand | Not applicable to this operating model |
| Property replacement-cycle demand | Depends on the specific site, territory, or operating condition |
| Competitive environment | Not included in the score |
| Labor and staffing friction | Measured; no meaningful local adjustment |
| Transportation, routing, and parking | Depends on the specific site, territory, or operating condition |
| Real estate and site feasibility | Not included in the score |
| Sales and customer acquisition | Not included in the score |
| Referral ecosystem | Not included in the score |
| Territory quality | -0.2 |
| Regulatory and operating friction | Depends on the specific site, territory, or operating condition |
| Full-precision calculated score | 69.79 |
| Published local-market alignment | 69.8 |
Factor calculations use full precision. Contributions and published scores are displayed to one decimal place; ranking order uses the full-precision score.
Evidence confidence
- City Modifier Evidence
- Strong
- Factor Research Coverage
- Adequate
- Franchise-profile completeness
- Adequate
- Source-evidence confidence
- Adequate
- Geographic applicability
- Limited
- Overall evidence confidence
- Moderate evidence confidence
- Largest absolute effect
- Territory quality -0.2 pts
- Tested rank range
- #3–#8
#6Tier 3 · Mixed modeled alignment69.8
FASTSIGNS
Initial investment: $231,226–$386,285
Increase +0.2 pts Target-market demandReduction -0.4 pts Territory quality
Rank sensitivity: Highly sensitive
Why it ranks here
Score-changing local factors only. Evidence links open the underlying city finding.
| Local factor | Modeled drivers | Impact |
|---|---|---|
| Territory quality |
| -0.4 pts |
| Target-market demand |
| +0.2 pts |
| Regulatory and operating friction | Signage and prototype adaptation burden EvidenceConditional — applicability must be confirmed | Not scored |
| Net local movement | -0.24 pts | |
Net uses full-precision effects; displayed factor and driver rows are rounded.
Franchise evidence
Source material assessed
Item 3 — Litigation
1 image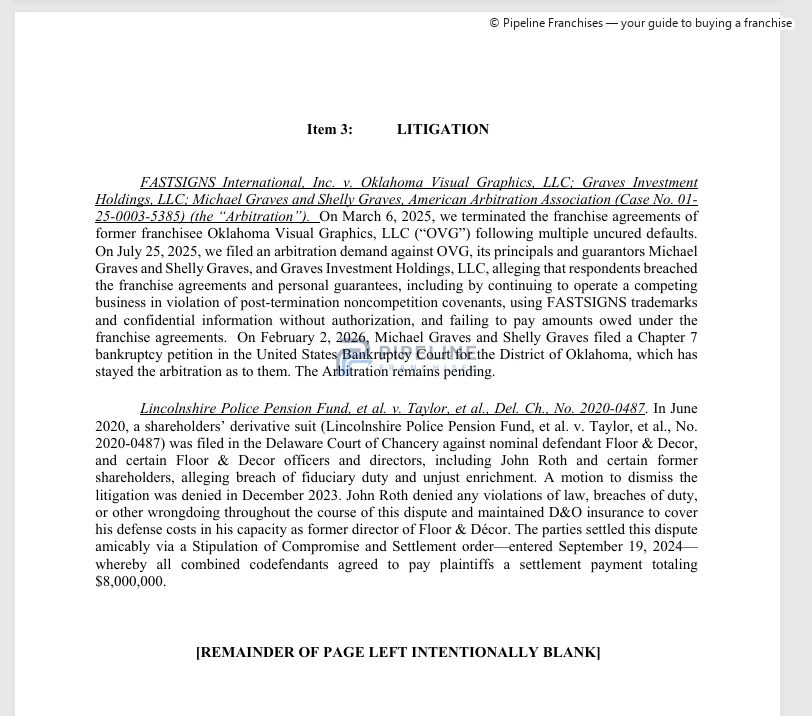
Item 6 — Other Fees
1 image
Item 7 — Estimated Initial Investment
2 images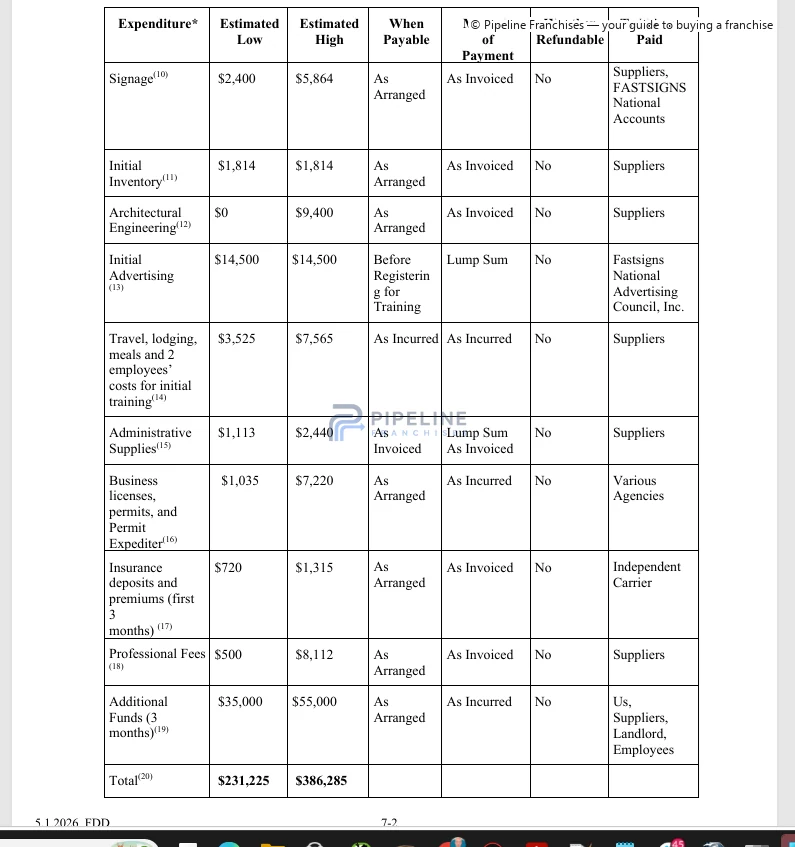
Item 12 — Territory
1 image
Item 20 — Outlets and Franchise Information
1 image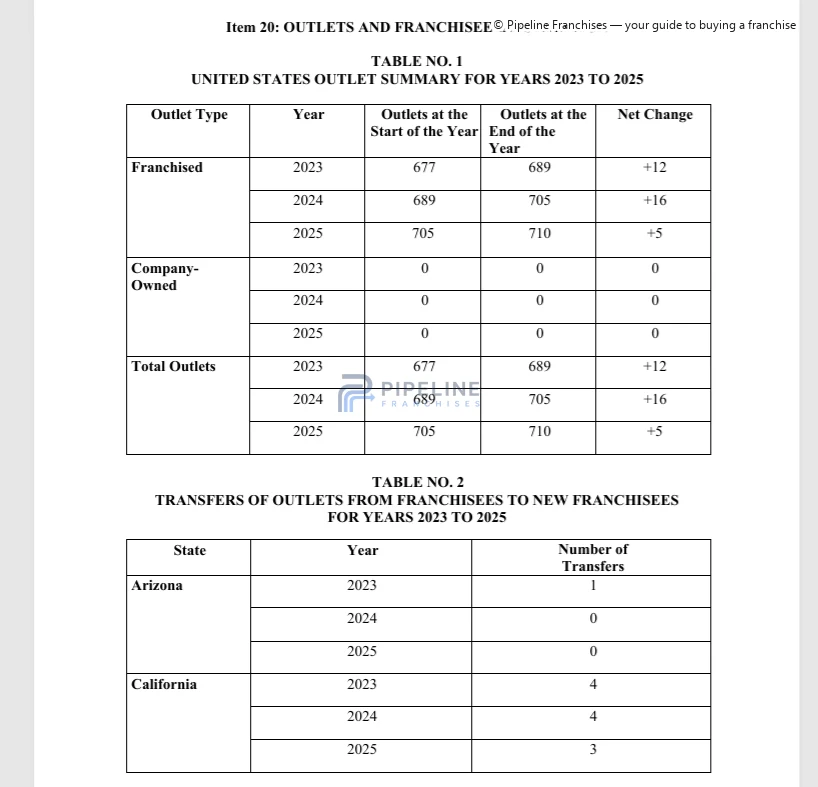
Item 19 — Financial Performance Representation
2 images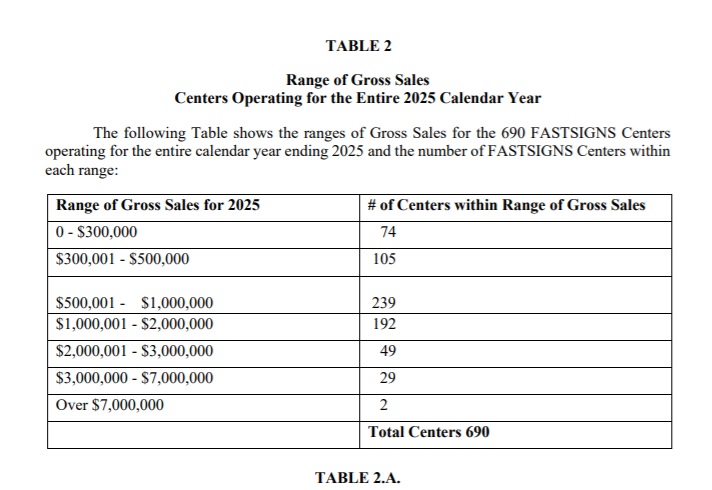
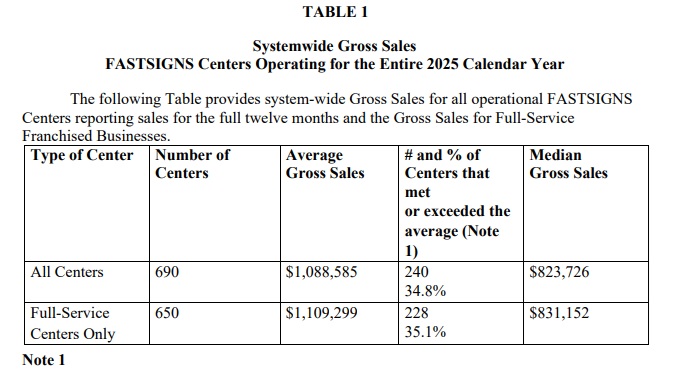
Public company data assessed
3 sourcesFull calculation and evidence confidence
Audit layer
Full factor ledger
Full score ledger
Every factor is classified so a displayed zero is not mistaken for a score-changing effect.
| Neutral model baseline | 70.0 |
|---|---|
| Target-market demand | +0.2 |
| Property replacement-cycle demand | Depends on the specific site, territory, or operating condition |
| Competitive environment | Not included in the score |
| Labor and staffing friction | Measured; no meaningful local adjustment |
| Transportation, routing, and parking | Depends on the specific site, territory, or operating condition |
| Real estate and site feasibility | Not included in the score |
| Sales and customer acquisition | Not included in the score |
| Referral ecosystem | Not included in the score |
| Territory quality | -0.4 |
| Regulatory and operating friction | Depends on the specific site, territory, or operating condition |
| Full-precision calculated score | 69.76 |
| Published local-market alignment | 69.8 |
Factor calculations use full precision. Contributions and published scores are displayed to one decimal place; ranking order uses the full-precision score.
Evidence confidence
- City Modifier Evidence
- Strong
- Factor Research Coverage
- Adequate
- Franchise-profile completeness
- Limited
- Source-evidence confidence
- Adequate
- Geographic applicability
- Limited
- Overall evidence confidence
- Moderate evidence confidence
- Largest absolute effect
- Territory quality -0.4 pts
- Tested rank range
- #3–#13
#7Tier 3 · Mixed modeled alignment69.7
Pillar To Post Home Inspectors
Initial investment: $102,690–$134,290
No material positive local adjustment identifiedReduction -0.3 pts Territory quality
Rank sensitivity: Highly sensitive
Why it ranks here
Score-changing local factors only. Evidence links open the underlying city finding.
| Local factor | Modeled drivers | Impact |
|---|---|---|
| Territory quality |
| -0.3 pts |
| Net local movement | -0.30 pts | |
Net uses full-precision effects; displayed factor and driver rows are rounded.
Franchise evidence
Source material assessed
Item 3 — Litigation
1 image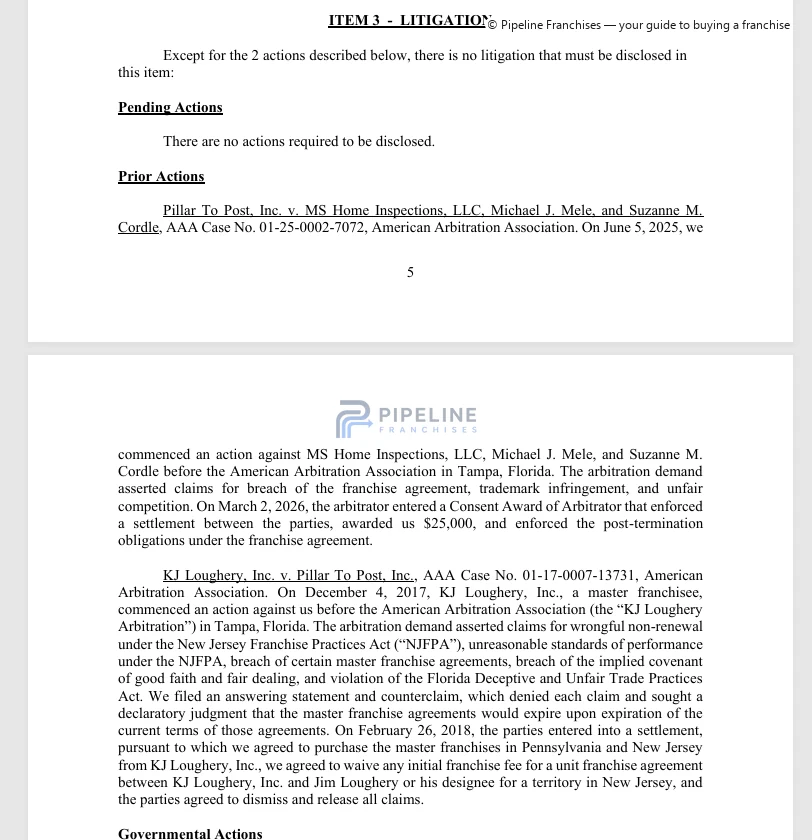
Item 6 — Other Fees
1 image
Item 7 — Estimated Initial Investment
2 images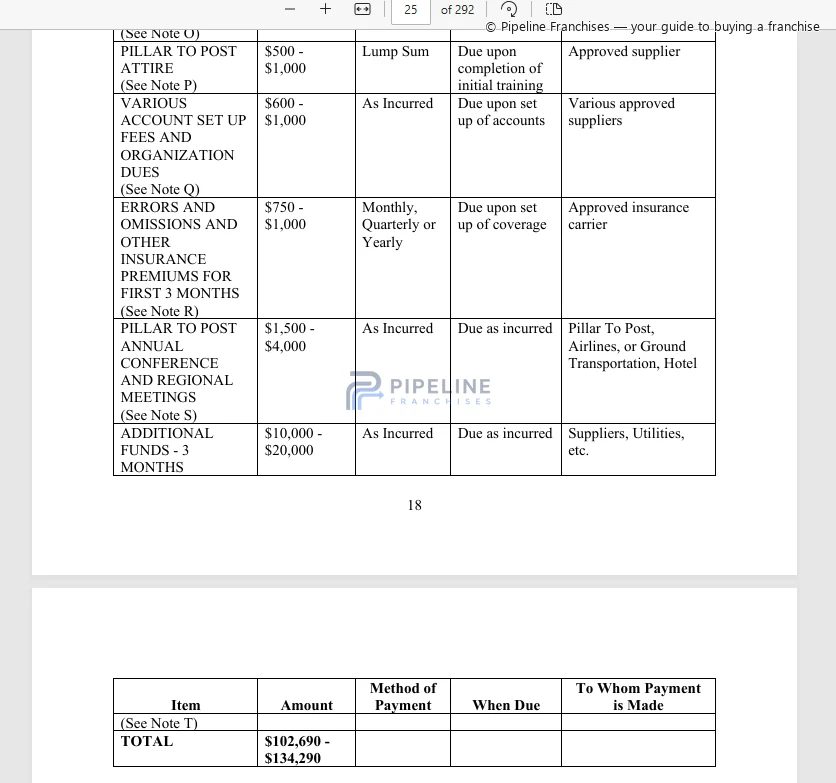
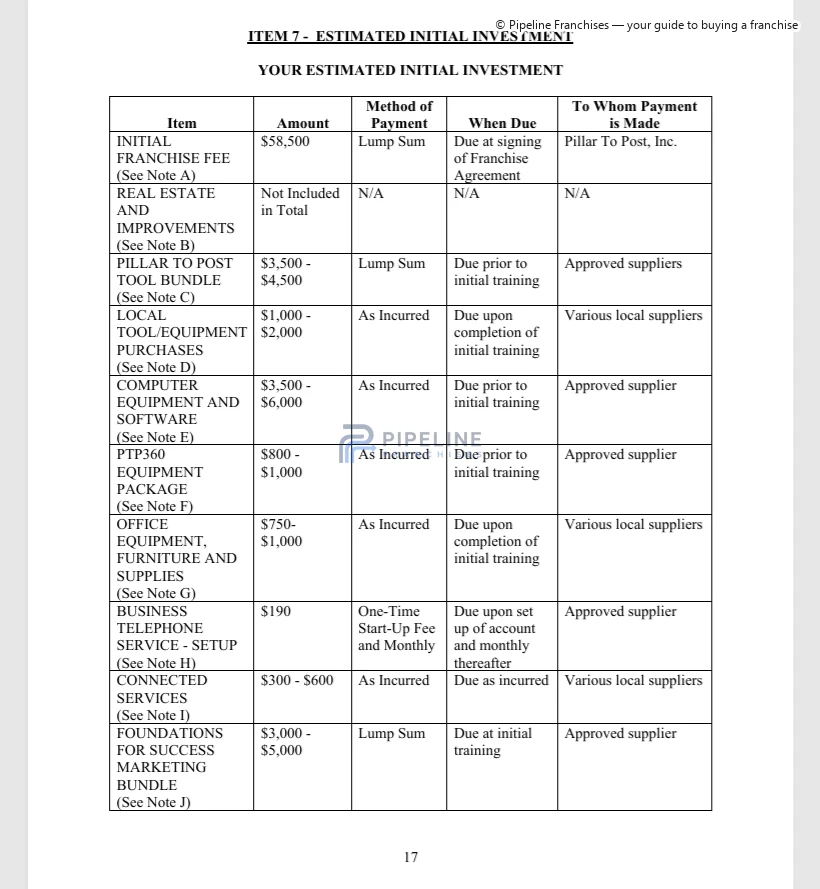
Item 12 — Territory
1 image
Item 19 — Financial Performance Representation
1 image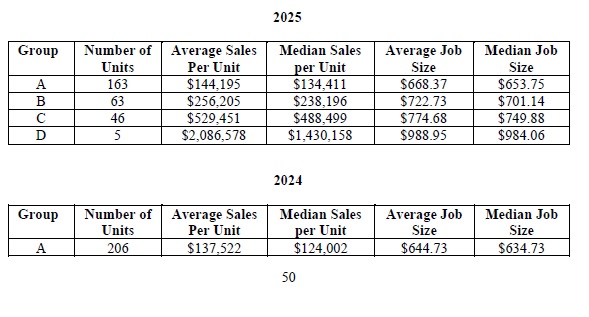
Public company data assessed
2 sourcesFull calculation and evidence confidence
Audit layer
Full factor ledger
Full score ledger
Every factor is classified so a displayed zero is not mistaken for a score-changing effect.
| Neutral model baseline | 70.0 |
|---|---|
| Target-market demand | Not applicable to this operating model |
| Property replacement-cycle demand | Depends on the specific site, territory, or operating condition |
| Competitive environment | Not included in the score |
| Labor and staffing friction | Measured; no meaningful local adjustment |
| Transportation, routing, and parking | Depends on the specific site, territory, or operating condition |
| Real estate and site feasibility | Not included in the score |
| Sales and customer acquisition | Not included in the score |
| Referral ecosystem | Not included in the score |
| Territory quality | -0.3 |
| Regulatory and operating friction | Depends on the specific site, territory, or operating condition |
| Full-precision calculated score | 69.70 |
| Published local-market alignment | 69.7 |
Factor calculations use full precision. Contributions and published scores are displayed to one decimal place; ranking order uses the full-precision score.
Evidence confidence
- City Modifier Evidence
- Strong
- Factor Research Coverage
- Adequate
- Franchise-profile completeness
- Limited
- Source-evidence confidence
- Adequate
- Geographic applicability
- Limited
- Overall evidence confidence
- Moderate evidence confidence
- Largest absolute effect
- Territory quality -0.3 pts
- Tested rank range
- #5–#12
#8Tier 3 · Mixed modeled alignment69.7
Rainbow International Restoration
Initial investment: $185,336–$351,900
Increase +0.1 pts Target-market demandReduction -0.4 pts Territory quality
Rank sensitivity: Highly sensitive
Why it ranks here
Score-changing local factors only. Evidence links open the underlying city finding.
| Local factor | Modeled drivers | Impact |
|---|---|---|
| Territory quality |
| -0.4 pts |
| Target-market demand |
| +0.1 pts |
| Net local movement | -0.30 pts | |
Net uses full-precision effects; displayed factor and driver rows are rounded.
Franchise evidence
Source material assessed
Item 3 — Litigation
1 image
Item 6 — Other Fees
1 image
Item 7 — Estimated Initial Investment
2 images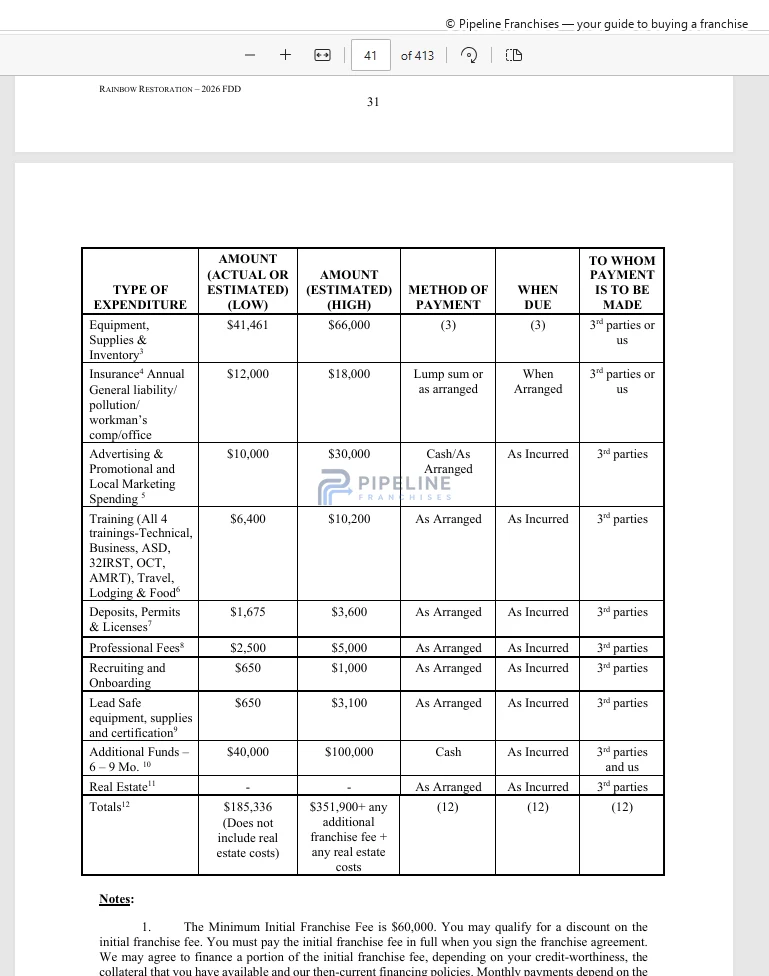
Item 12 — Territory
1 image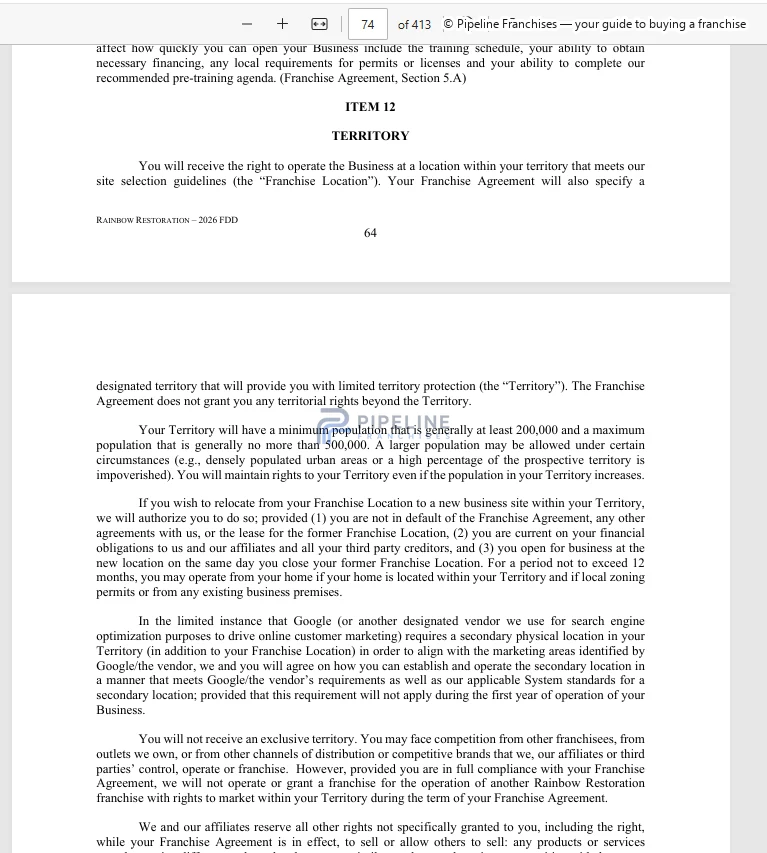
Item 20 — Outlets and Franchise Information
1 image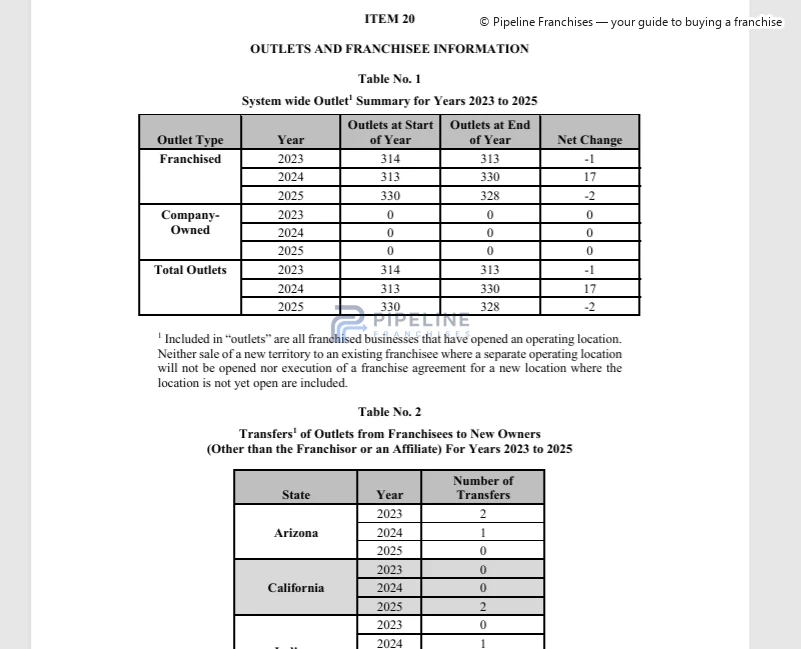
Full calculation and evidence confidence
Audit layer
Full factor ledger
Full score ledger
Every factor is classified so a displayed zero is not mistaken for a score-changing effect.
| Neutral model baseline | 70.0 |
|---|---|
| Target-market demand | +0.1 |
| Property replacement-cycle demand | Depends on the specific site, territory, or operating condition |
| Competitive environment | Not included in the score |
| Labor and staffing friction | Measured; no meaningful local adjustment |
| Transportation, routing, and parking | Depends on the specific site, territory, or operating condition |
| Real estate and site feasibility | Not included in the score |
| Sales and customer acquisition | Not included in the score |
| Referral ecosystem | Not included in the score |
| Territory quality | -0.4 |
| Regulatory and operating friction | Depends on the specific site, territory, or operating condition |
| Full-precision calculated score | 69.70 |
| Published local-market alignment | 69.7 |
Factor calculations use full precision. Contributions and published scores are displayed to one decimal place; ranking order uses the full-precision score.
Evidence confidence
- City Modifier Evidence
- Strong
- Factor Research Coverage
- Adequate
- Franchise-profile completeness
- Limited
- Source-evidence confidence
- Adequate
- Geographic applicability
- Limited
- Overall evidence confidence
- Moderate evidence confidence
- Largest absolute effect
- Territory quality -0.4 pts
- Tested rank range
- #5–#9
#9Tier 3 · Mixed modeled alignment69.7
Aire Serv
Initial investment: $113,308–$271,708
No material positive local adjustment identifiedReduction -0.3 pts Territory quality
Rank sensitivity: Moderately sensitive
Why it ranks here
Score-changing local factors only. Evidence links open the underlying city finding.
| Local factor | Modeled drivers | Impact |
|---|---|---|
| Territory quality |
| -0.3 pts |
| Transportation, routing, and parking | Temporary route disruption EvidenceConditional — applicability must be confirmed | Not scored |
| Net local movement | -0.34 pts | |
Net uses full-precision effects; displayed factor and driver rows are rounded.
Franchise evidence
Source material assessed
Item 3 — Litigation
1 image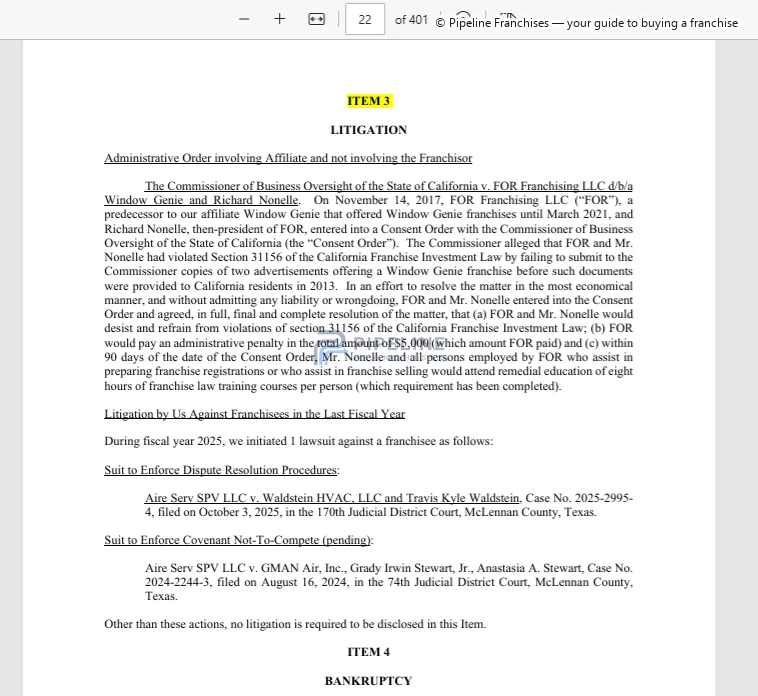
Item 6 — Other Fees
1 image
Item 7 — Estimated Initial Investment
1 image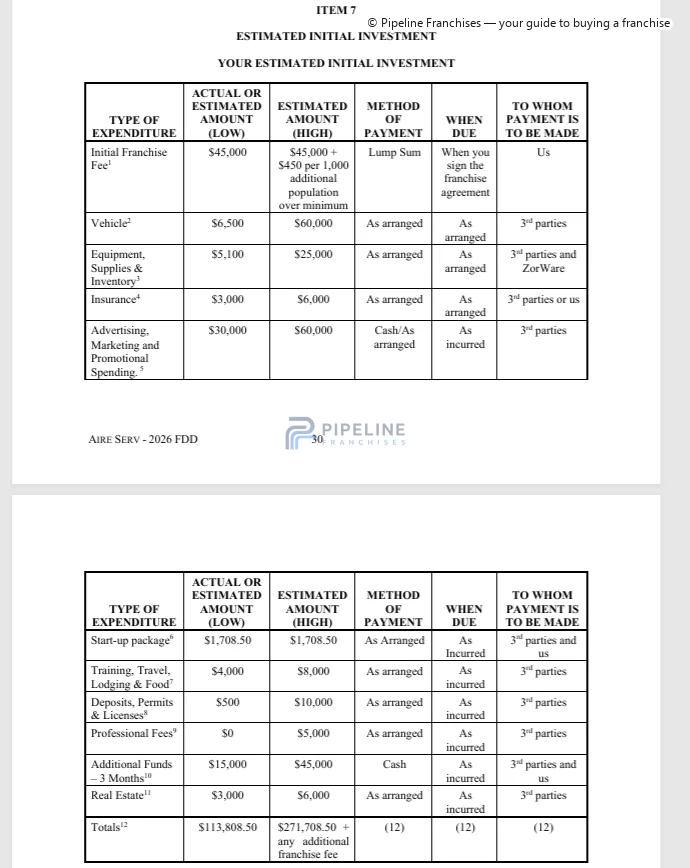
Item 12 — Territory
1 image
Item 20 — Outlets and Franchise Information
1 image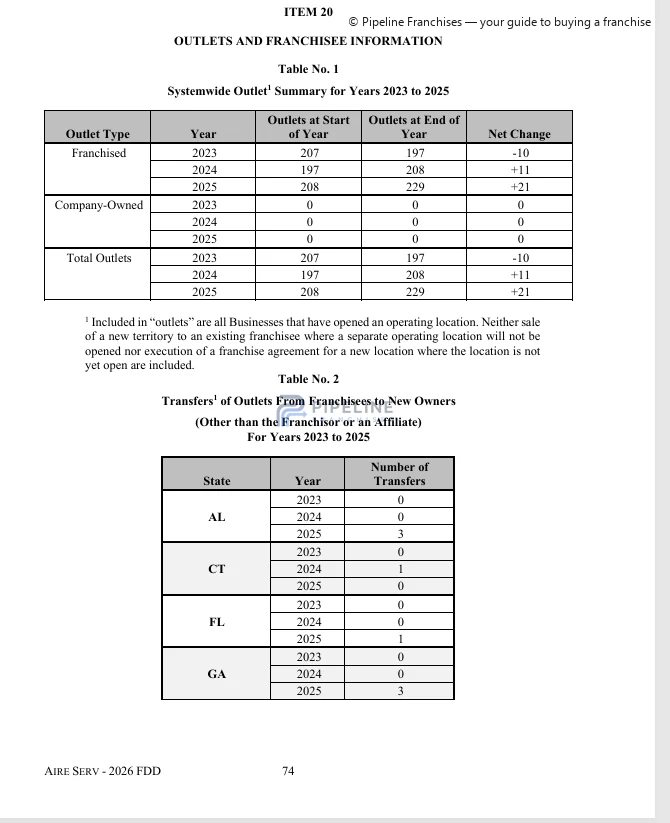
Item 19 — Financial Performance Representation
1 image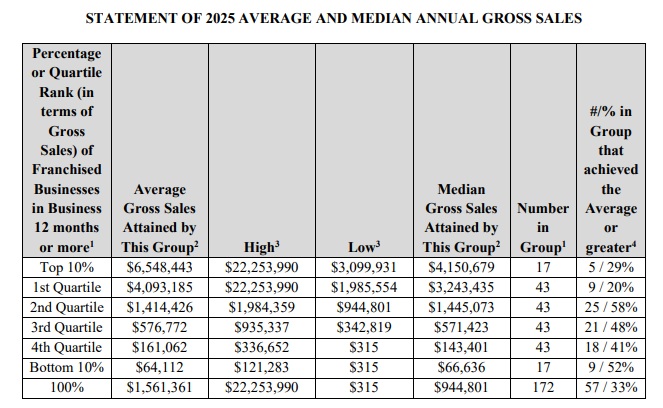
Public company data assessed
1 sourceFull calculation and evidence confidence
Audit layer
Full factor ledger
Full score ledger
Every factor is classified so a displayed zero is not mistaken for a score-changing effect.
| Neutral model baseline | 70.0 |
|---|---|
| Target-market demand | Not applicable to this operating model |
| Property replacement-cycle demand | Depends on the specific site, territory, or operating condition |
| Competitive environment | Not included in the score |
| Labor and staffing friction | Measured; no meaningful local adjustment |
| Transportation, routing, and parking | Depends on the specific site, territory, or operating condition |
| Real estate and site feasibility | Not included in the score |
| Sales and customer acquisition | Not included in the score |
| Referral ecosystem | Not included in the score |
| Territory quality | -0.3 |
| Regulatory and operating friction | Depends on the specific site, territory, or operating condition |
| Full-precision calculated score | 69.66 |
| Published local-market alignment | 69.7 |
Factor calculations use full precision. Contributions and published scores are displayed to one decimal place; ranking order uses the full-precision score.
Evidence confidence
- City Modifier Evidence
- Strong
- Factor Research Coverage
- Adequate
- Franchise-profile completeness
- Adequate
- Source-evidence confidence
- Adequate
- Geographic applicability
- Limited
- Overall evidence confidence
- Moderate evidence confidence
- Largest absolute effect
- Territory quality -0.3 pts
- Tested rank range
- #6–#9
#10Tier 3 · Mixed modeled alignment69.6
Mister Sparky Electric
No material positive local adjustment identifiedReduction -0.4 pts Territory quality
Rank sensitivity: Moderately sensitive
Why it ranks here
Score-changing local factors only. Evidence links open the underlying city finding.
| Local factor | Modeled drivers | Impact |
|---|---|---|
| Territory quality |
| -0.4 pts |
| Transportation, routing, and parking | Temporary route disruption EvidenceConditional — applicability must be confirmed | Not scored |
| Net local movement | -0.35 pts | |
Net uses full-precision effects; displayed factor and driver rows are rounded.
Full calculation and evidence confidence
Audit layer
Full factor ledger
Full score ledger
Every factor is classified so a displayed zero is not mistaken for a score-changing effect.
| Neutral model baseline | 70.0 |
|---|---|
| Target-market demand | Not applicable to this operating model |
| Property replacement-cycle demand | Depends on the specific site, territory, or operating condition |
| Competitive environment | Not included in the score |
| Labor and staffing friction | Measured; no meaningful local adjustment |
| Transportation, routing, and parking | Depends on the specific site, territory, or operating condition |
| Real estate and site feasibility | Not included in the score |
| Sales and customer acquisition | Not included in the score |
| Referral ecosystem | Not included in the score |
| Territory quality | -0.4 |
| Regulatory and operating friction | Depends on the specific site, territory, or operating condition |
| Full-precision calculated score | 69.65 |
| Published local-market alignment | 69.6 |
Factor calculations use full precision. Contributions and published scores are displayed to one decimal place; ranking order uses the full-precision score.
Evidence confidence
- City Modifier Evidence
- Strong
- Factor Research Coverage
- Adequate
- Franchise-profile completeness
- Limited
- Source-evidence confidence
- Adequate
- Geographic applicability
- Limited
- Overall evidence confidence
- Moderate evidence confidence
- Largest absolute effect
- Territory quality -0.4 pts
- Tested rank range
- #8–#11
#11Tier 3 · Mixed modeled alignment69.6
PuroClean
Initial investment: $54,575–$262,145
No material positive local adjustment identifiedReduction -0.4 pts Territory quality
Rank sensitivity: Moderately sensitive
Why it ranks here
Score-changing local factors only. Evidence links open the underlying city finding.
| Local factor | Modeled drivers | Impact |
|---|---|---|
| Territory quality |
| -0.4 pts |
| Net local movement | -0.37 pts | |
Net uses full-precision effects; displayed factor and driver rows are rounded.
Franchise evidence
Source material assessed
Item 3 — Litigation
1 image
Item 6 — Other Fees
1 image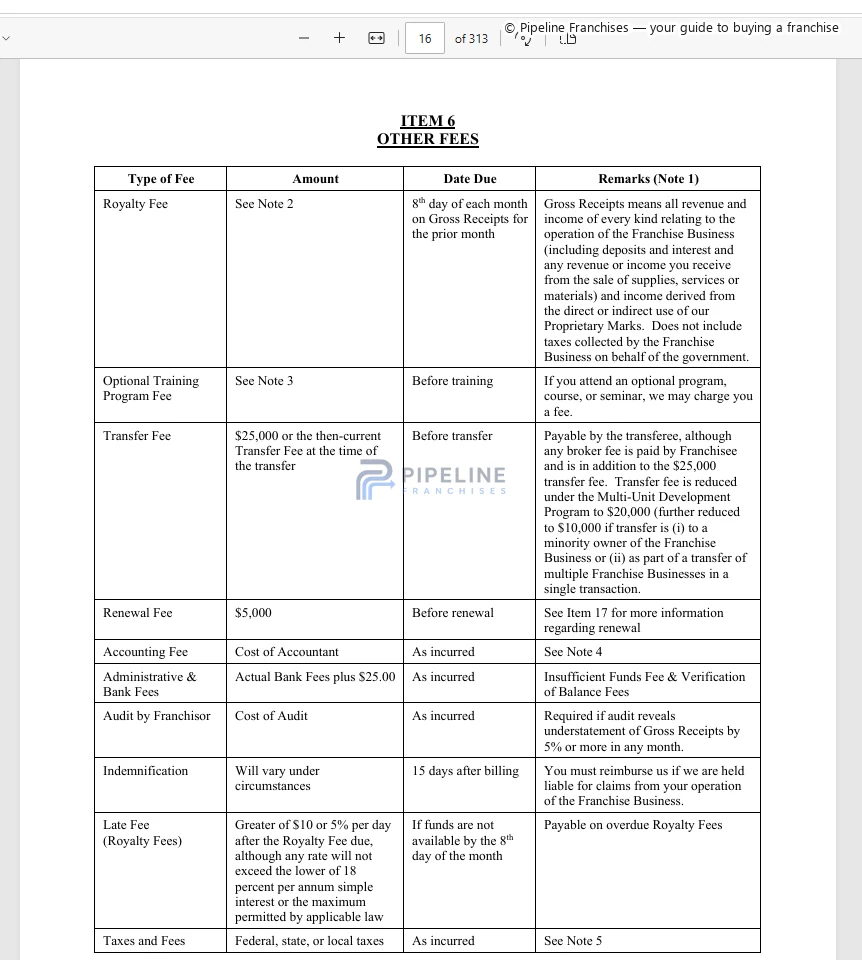
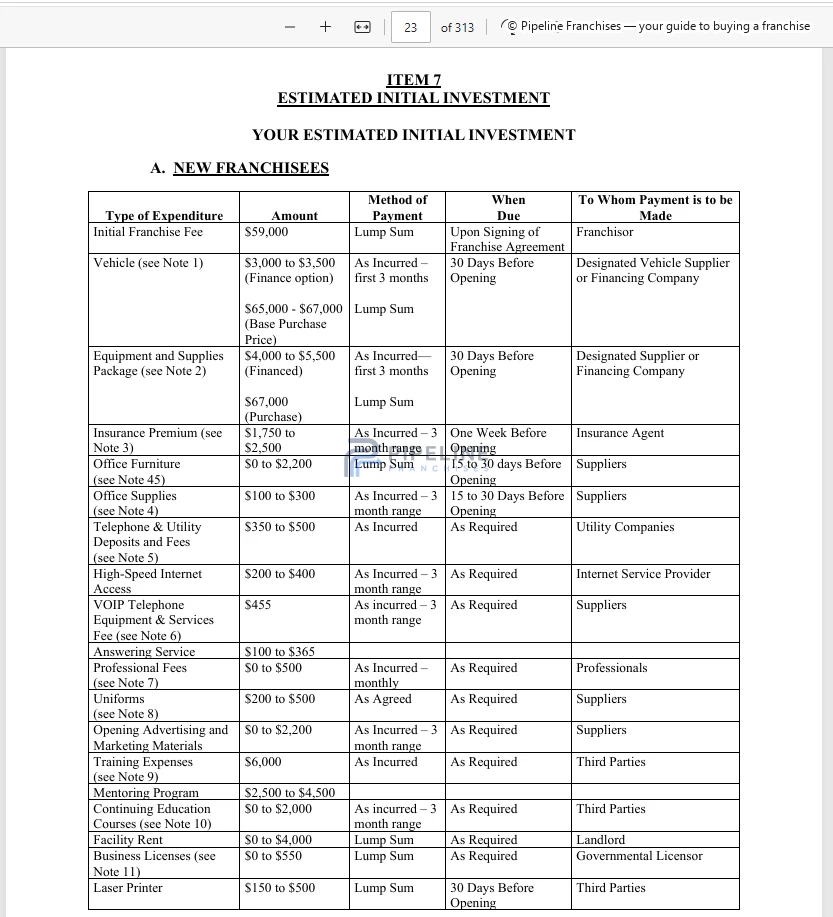
Item 7 — Estimated Initial Investment
2 images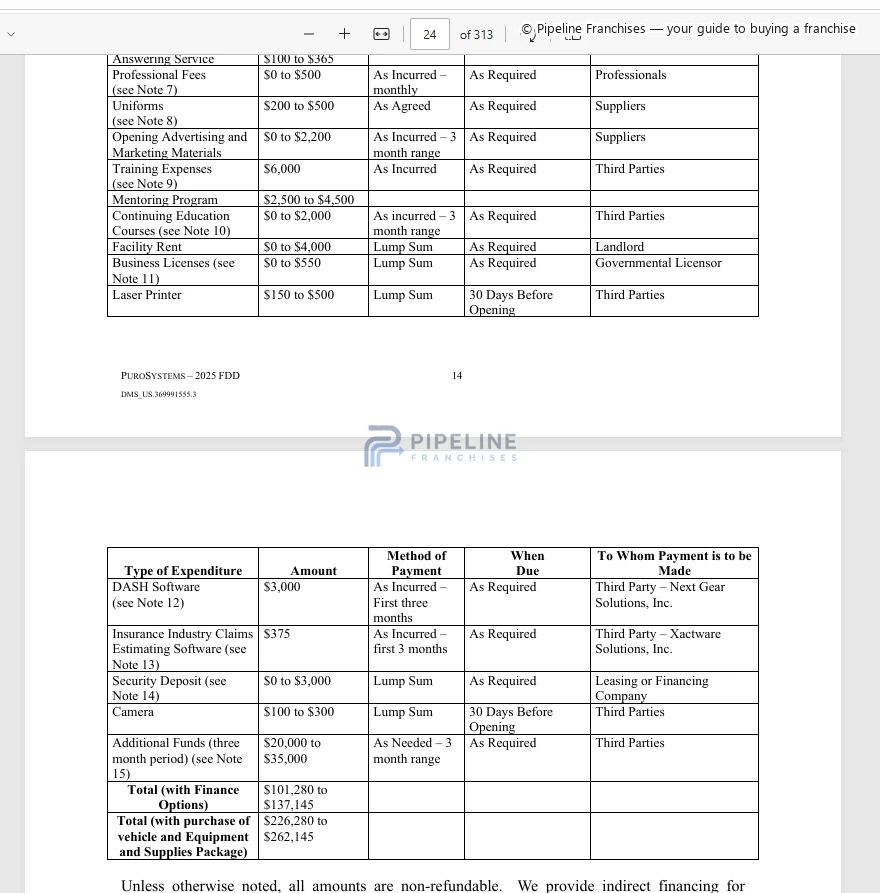
Item 12 — Territory
1 image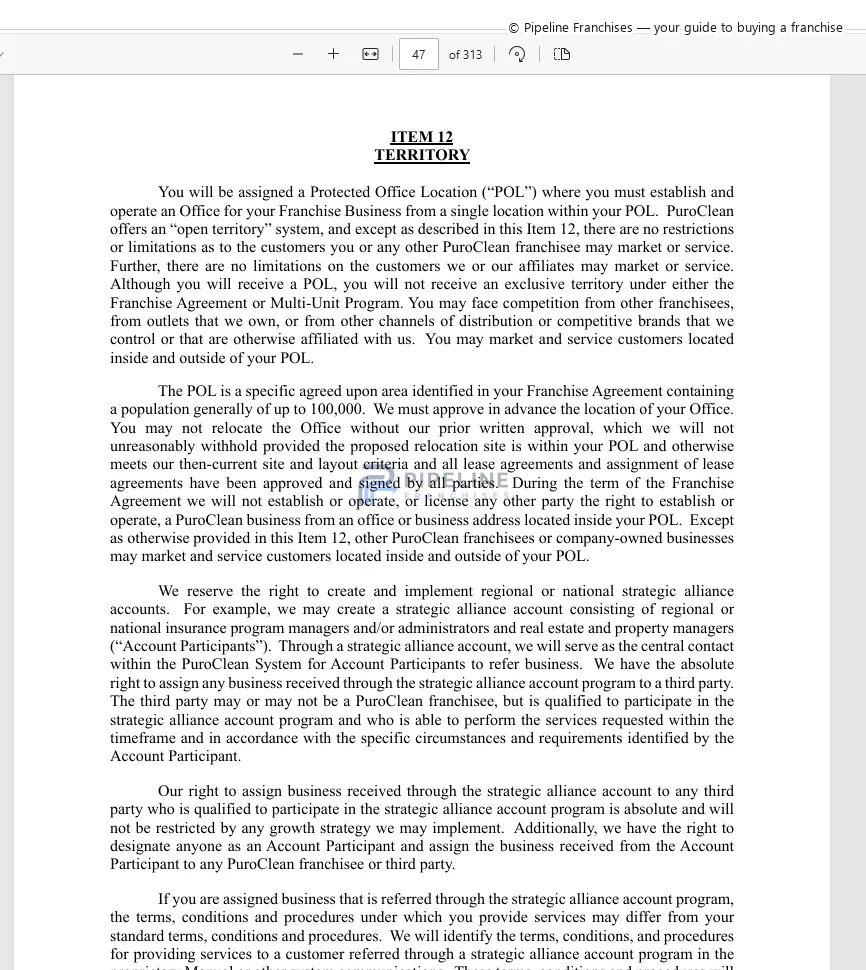
Item 20 — Outlets and Franchise Information
1 image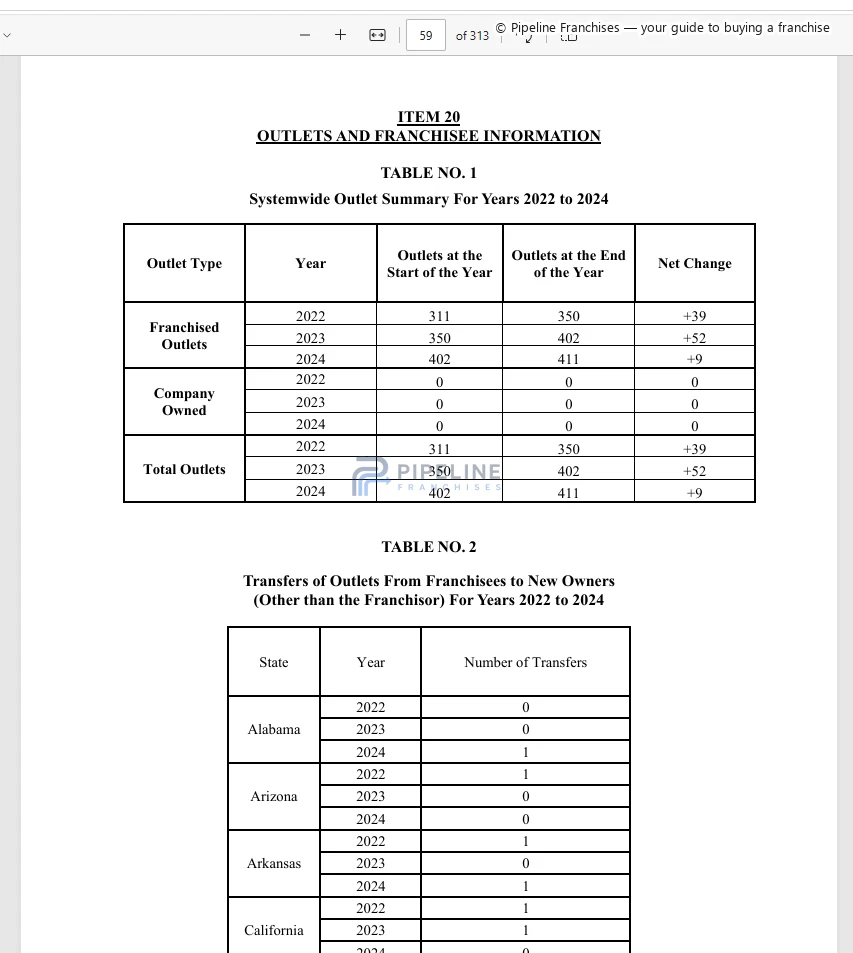
Full calculation and evidence confidence
Audit layer
Full factor ledger
Full score ledger
Every factor is classified so a displayed zero is not mistaken for a score-changing effect.
| Neutral model baseline | 70.0 |
|---|---|
| Target-market demand | Not applicable to this operating model |
| Property replacement-cycle demand | Depends on the specific site, territory, or operating condition |
| Competitive environment | Not included in the score |
| Labor and staffing friction | Measured; no meaningful local adjustment |
| Transportation, routing, and parking | Depends on the specific site, territory, or operating condition |
| Real estate and site feasibility | Not included in the score |
| Sales and customer acquisition | Not included in the score |
| Referral ecosystem | Not included in the score |
| Territory quality | -0.4 |
| Regulatory and operating friction | Depends on the specific site, territory, or operating condition |
| Full-precision calculated score | 69.63 |
| Published local-market alignment | 69.6 |
Factor calculations use full precision. Contributions and published scores are displayed to one decimal place; ranking order uses the full-precision score.
Evidence confidence
- City Modifier Evidence
- Strong
- Factor Research Coverage
- Adequate
- Franchise-profile completeness
- Limited
- Source-evidence confidence
- Adequate
- Geographic applicability
- Limited
- Overall evidence confidence
- Moderate evidence confidence
- Largest absolute effect
- Territory quality -0.4 pts
- Tested rank range
- #10–#13
#12Tier 3 · Mixed modeled alignment69.6
Mr. Rooter
Initial investment: $152,900–$298,675
No material positive local adjustment identifiedReduction -0.4 pts Territory quality
Rank sensitivity: Moderately sensitive
Why it ranks here
Score-changing local factors only. Evidence links open the underlying city finding.
| Local factor | Modeled drivers | Impact |
|---|---|---|
| Territory quality |
| -0.4 pts |
| Transportation, routing, and parking | Temporary route disruption EvidenceConditional — applicability must be confirmed | Not scored |
| Net local movement | -0.39 pts | |
Net uses full-precision effects; displayed factor and driver rows are rounded.
Franchise evidence
Source material assessed
Item 3 — Litigation
1 image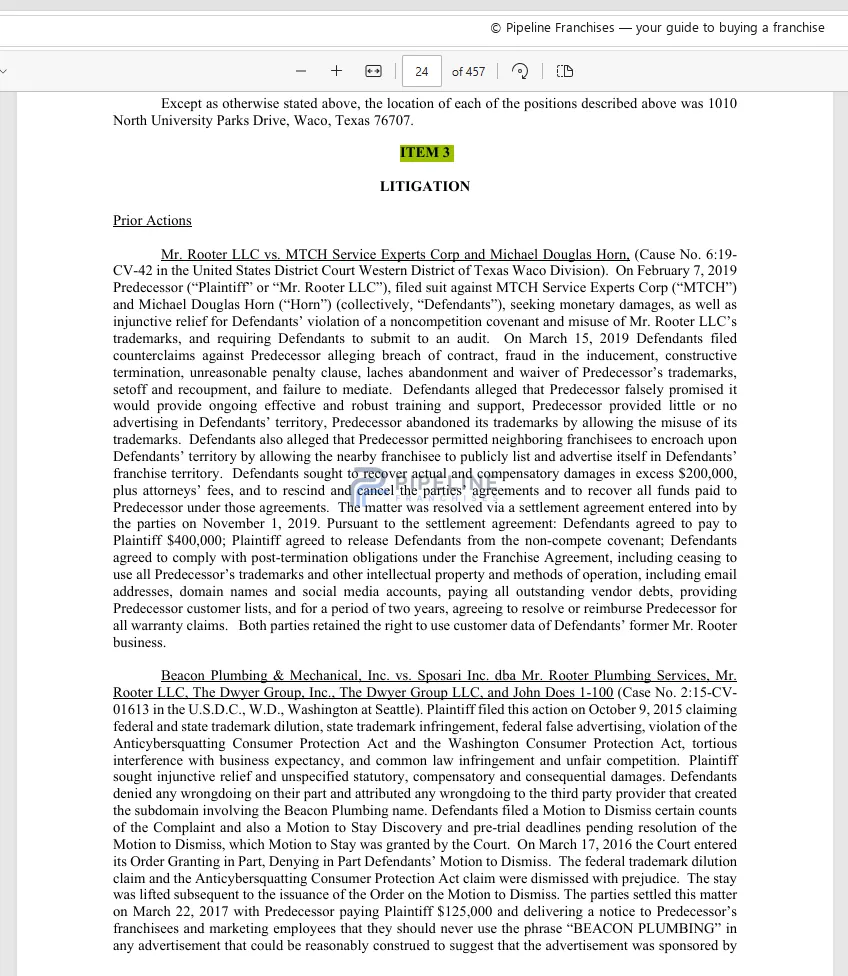
Item 6 — Other Fees
1 image
Item 7 — Estimated Initial Investment
2 images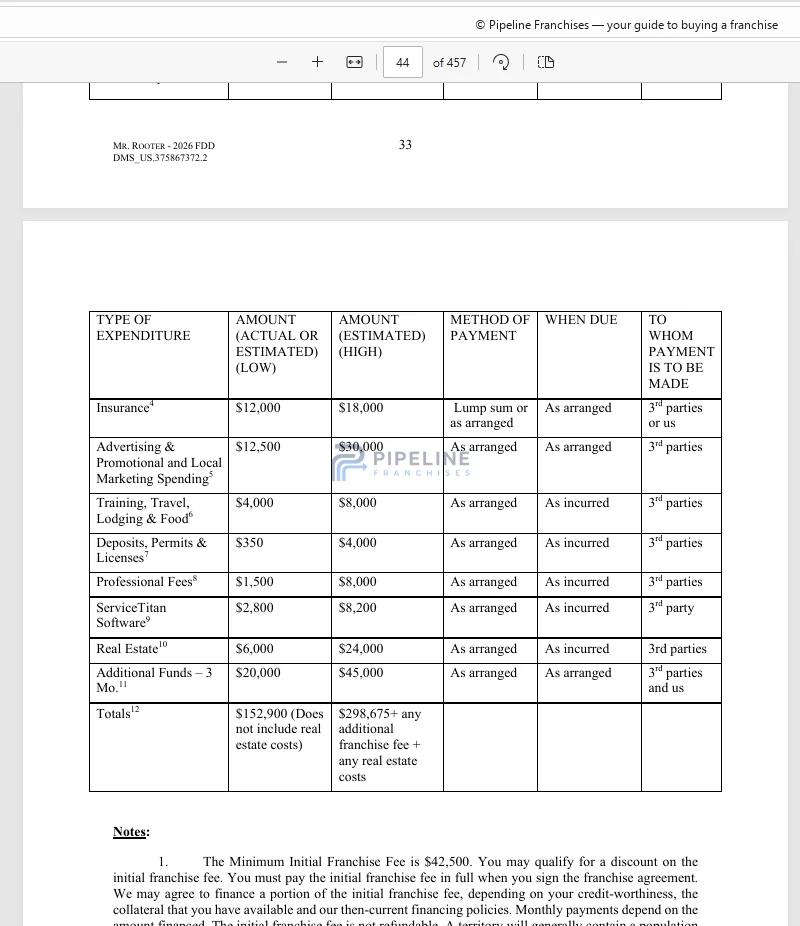
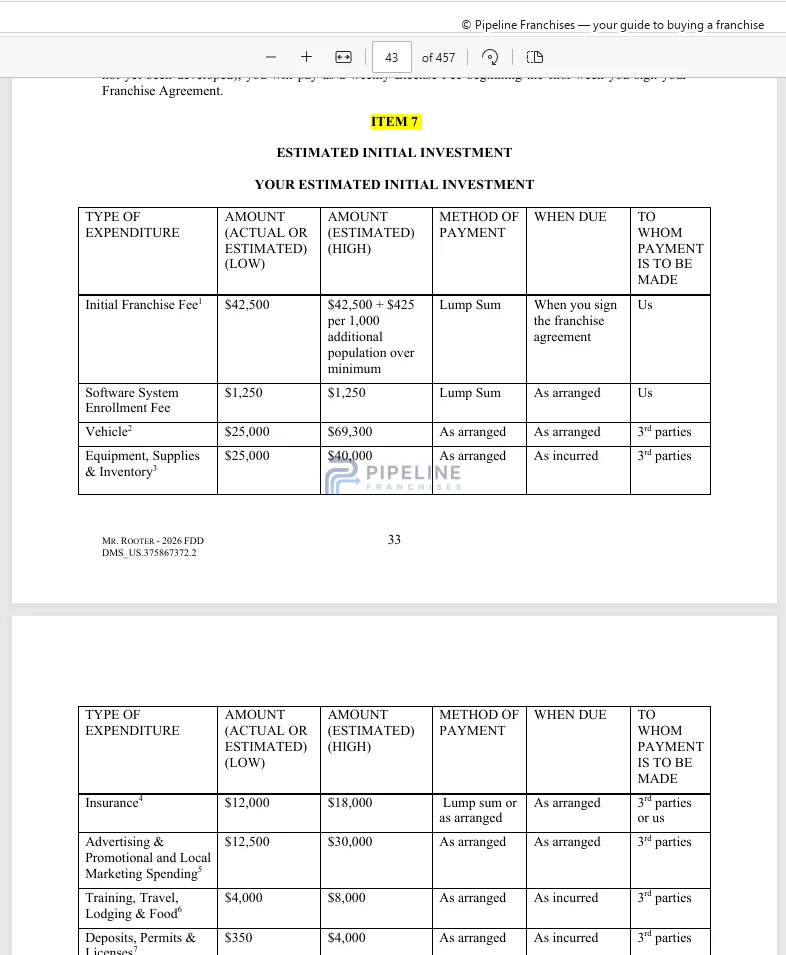
Item 12 — Territory
1 image
Item 20 — Outlets and Franchise Information
1 image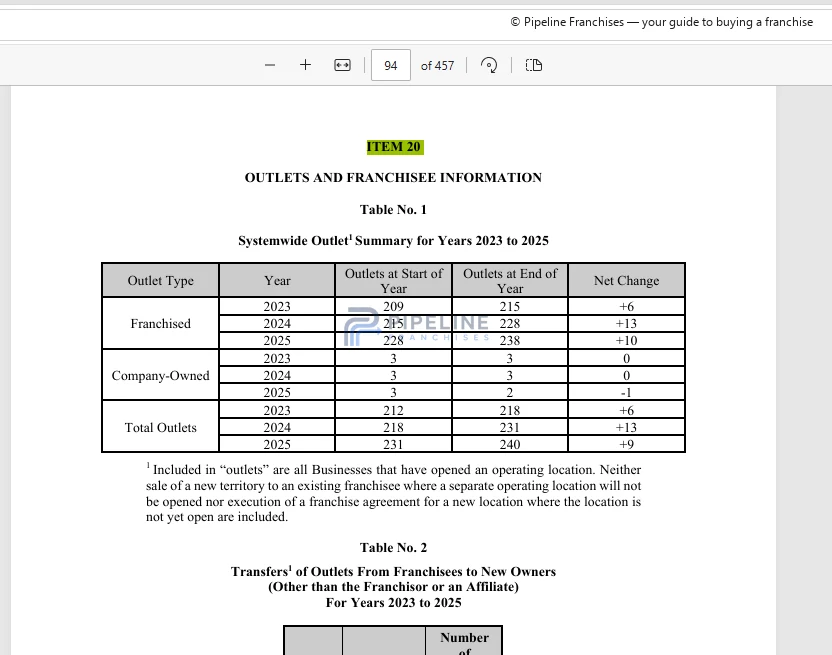
Full calculation and evidence confidence
Audit layer
Full factor ledger
Full score ledger
Every factor is classified so a displayed zero is not mistaken for a score-changing effect.
| Neutral model baseline | 70.0 |
|---|---|
| Target-market demand | Not applicable to this operating model |
| Property replacement-cycle demand | Depends on the specific site, territory, or operating condition |
| Competitive environment | Not included in the score |
| Labor and staffing friction | Measured; no meaningful local adjustment |
| Transportation, routing, and parking | Depends on the specific site, territory, or operating condition |
| Real estate and site feasibility | Not included in the score |
| Sales and customer acquisition | Not included in the score |
| Referral ecosystem | Not included in the score |
| Territory quality | -0.4 |
| Regulatory and operating friction | Depends on the specific site, territory, or operating condition |
| Full-precision calculated score | 69.61 |
| Published local-market alignment | 69.6 |
Factor calculations use full precision. Contributions and published scores are displayed to one decimal place; ranking order uses the full-precision score.
Evidence confidence
- City Modifier Evidence
- Strong
- Factor Research Coverage
- Adequate
- Franchise-profile completeness
- Limited
- Source-evidence confidence
- Adequate
- Geographic applicability
- Limited
- Overall evidence confidence
- Moderate evidence confidence
- Largest absolute effect
- Territory quality -0.4 pts
- Tested rank range
- #10–#12
#13Tier 3 · Mixed modeled alignment69.6
ZOOM DRAIN
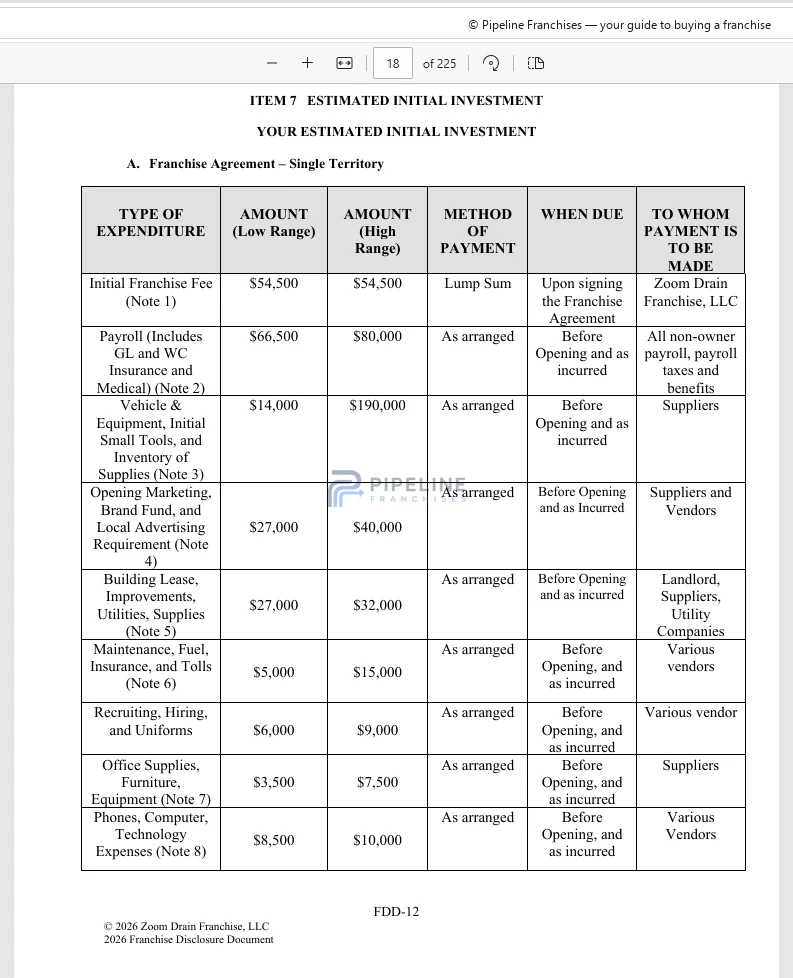
Initial investment: $266,250–$570,500
No material positive local adjustment identifiedReduction -0.4 pts Territory quality
Rank sensitivity: Highly sensitive
Why it ranks here
Score-changing local factors only. Evidence links open the underlying city finding.
| Local factor | Modeled drivers | Impact |
|---|---|---|
| Territory quality |
| -0.4 pts |
| Transportation, routing, and parking | Temporary route disruption EvidenceConditional — applicability must be confirmed | Not scored |
| Net local movement | -0.40 pts | |
Net uses full-precision effects; displayed factor and driver rows are rounded.
Franchise evidence
Source material assessed
Item 3 — Litigation
1 image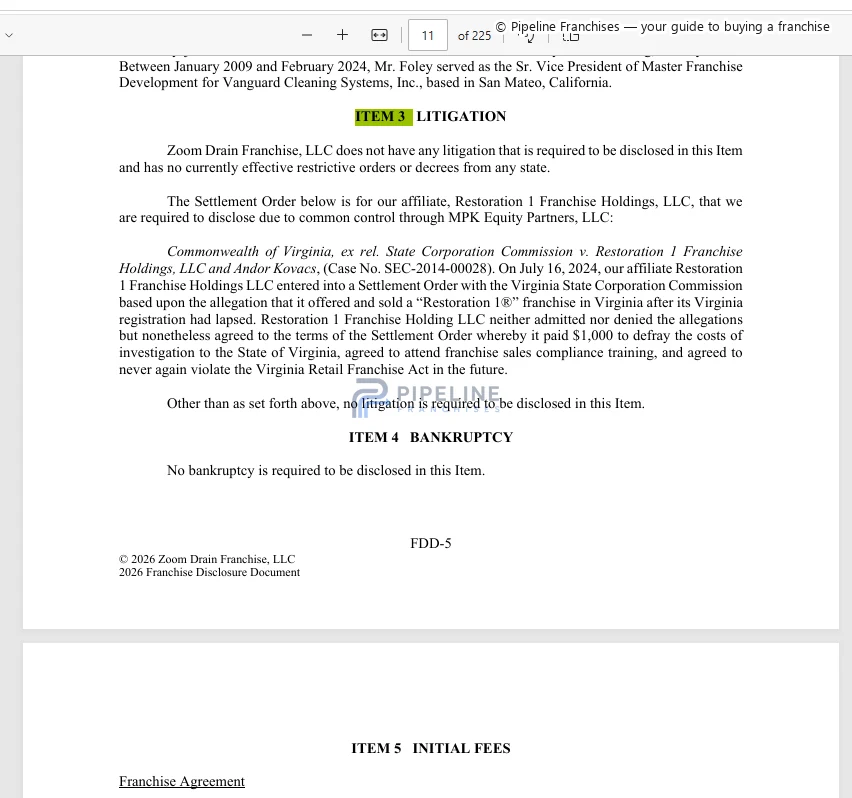
Item 6 — Other Fees
1 image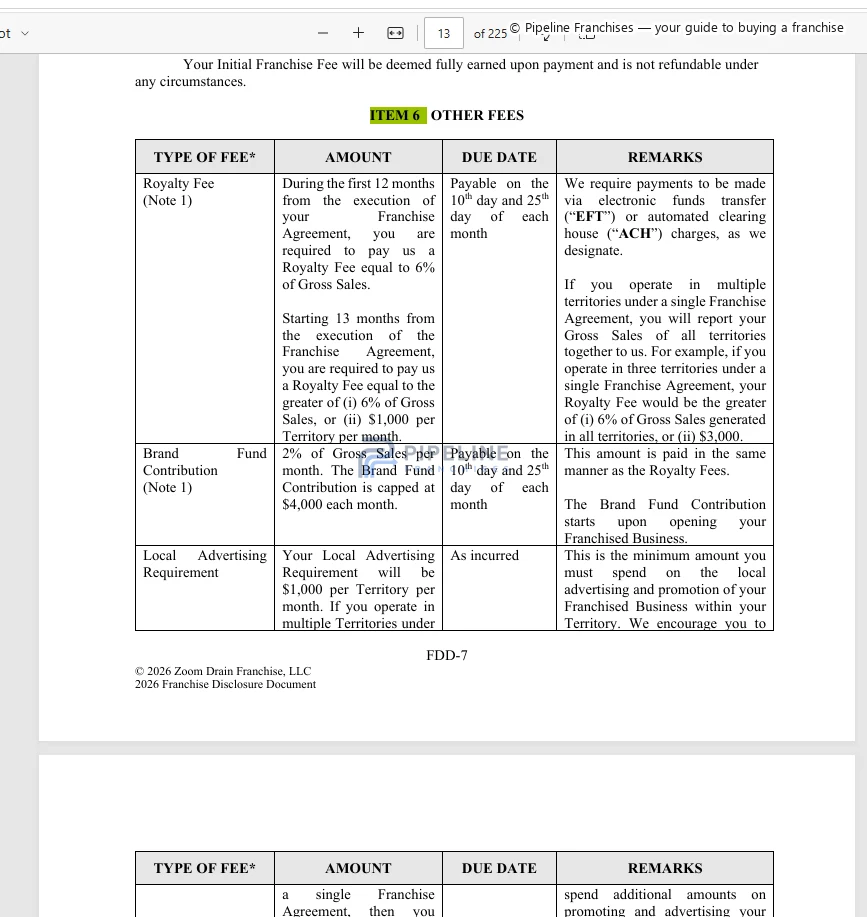
Item 7 — Estimated Initial Investment
2 images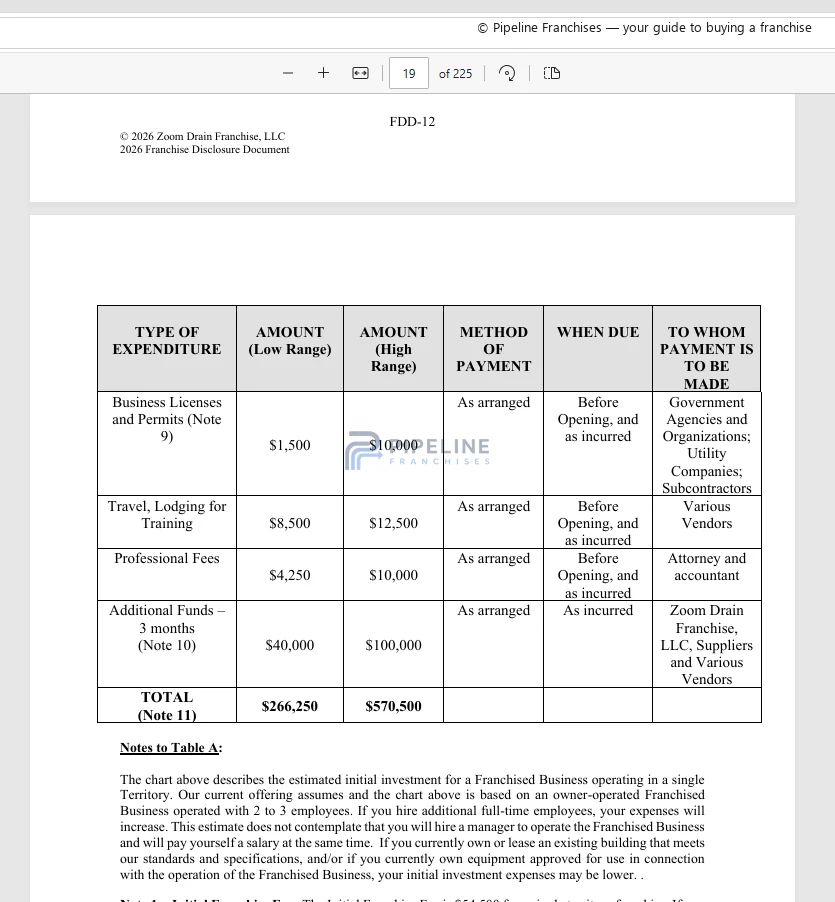
Item 12 — Territory
1 image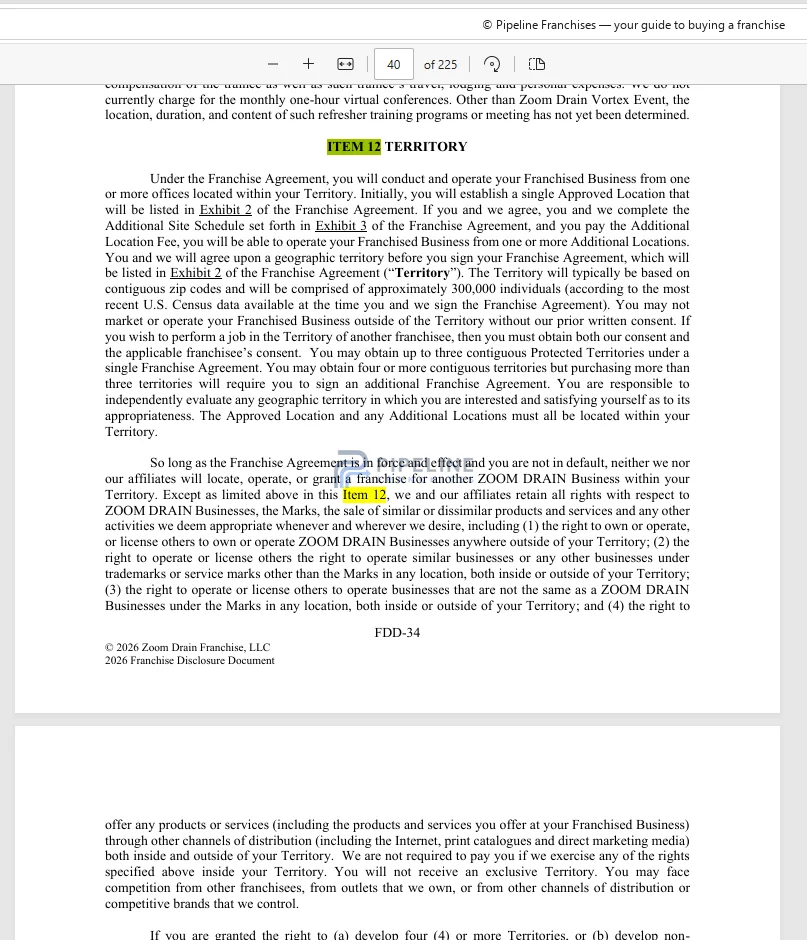
Item 20 — Outlets and Franchise Information
1 image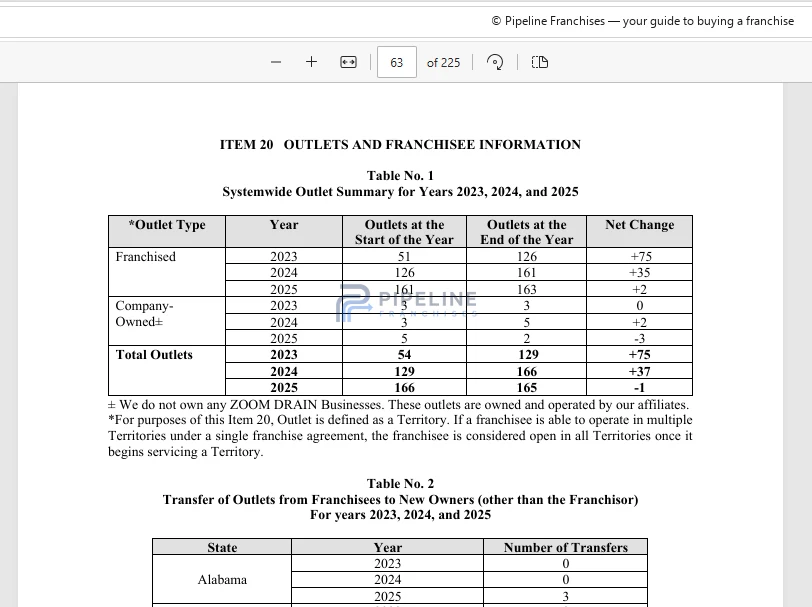
Full calculation and evidence confidence
Audit layer
Full factor ledger
Full score ledger
Every factor is classified so a displayed zero is not mistaken for a score-changing effect.
| Neutral model baseline | 70.0 |
|---|---|
| Target-market demand | Not applicable to this operating model |
| Property replacement-cycle demand | Depends on the specific site, territory, or operating condition |
| Competitive environment | Not included in the score |
| Labor and staffing friction | Measured; no meaningful local adjustment |
| Transportation, routing, and parking | Depends on the specific site, territory, or operating condition |
| Real estate and site feasibility | Not included in the score |
| Sales and customer acquisition | Not included in the score |
| Referral ecosystem | Not included in the score |
| Territory quality | -0.4 |
| Regulatory and operating friction | Depends on the specific site, territory, or operating condition |
| Full-precision calculated score | 69.60 |
| Published local-market alignment | 69.6 |
Factor calculations use full precision. Contributions and published scores are displayed to one decimal place; ranking order uses the full-precision score.
Evidence confidence
- City Modifier Evidence
- Strong
- Factor Research Coverage
- Adequate
- Franchise-profile completeness
- Limited
- Source-evidence confidence
- Adequate
- Geographic applicability
- Limited
- Overall evidence confidence
- Moderate evidence confidence
- Largest absolute effect
- Territory quality -0.4 pts
- Tested rank range
- #9–#13
#14Tier 3 · Mixed modeled alignment69.3
Workout Anytime
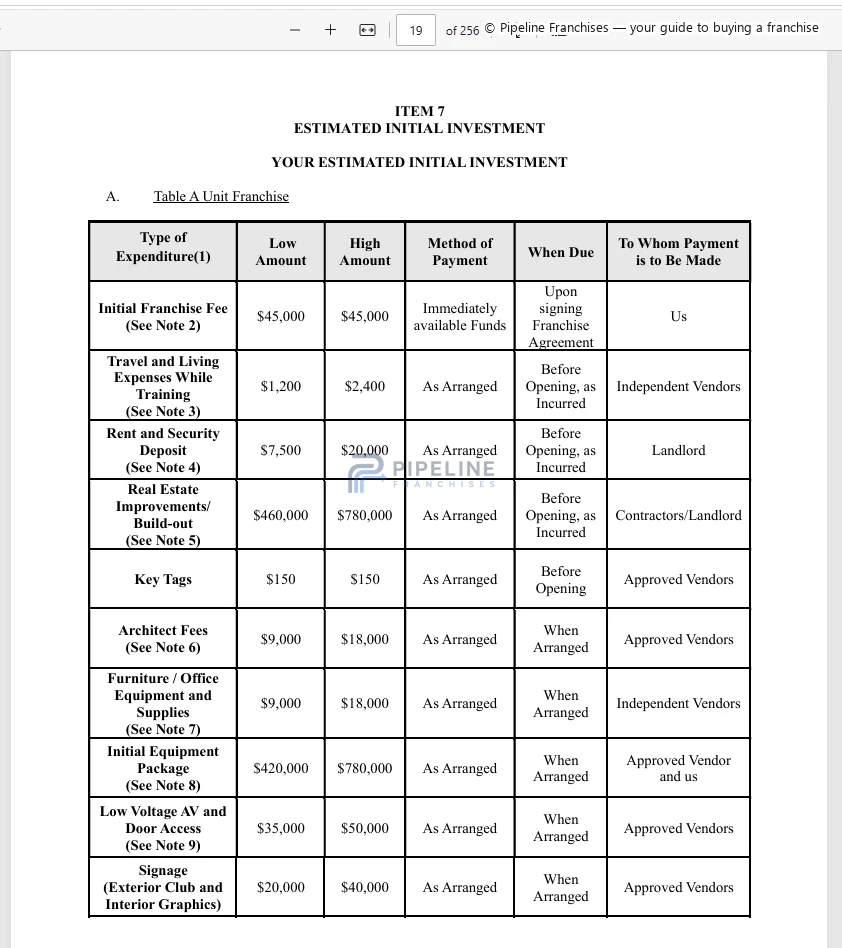
Initial investment: $1,060,850–$1,840,550
No material positive local adjustment identifiedReduction -0.7 pts Territory quality
Rank sensitivity: Stable
Why it ranks here
Score-changing local factors only. Evidence links open the underlying city finding.
| Local factor | Modeled drivers | Impact |
|---|---|---|
| Territory quality |
| -0.7 pts |
| Regulatory and operating friction | Signage and prototype adaptation burden EvidenceConditional — applicability must be confirmed | Not scored |
| Net local movement | -0.73 pts | |
Net uses full-precision effects; displayed factor and driver rows are rounded.
Franchise evidence
Source material assessed
Item 3 — Litigation
1 image
Item 6 — Other Fees
1 image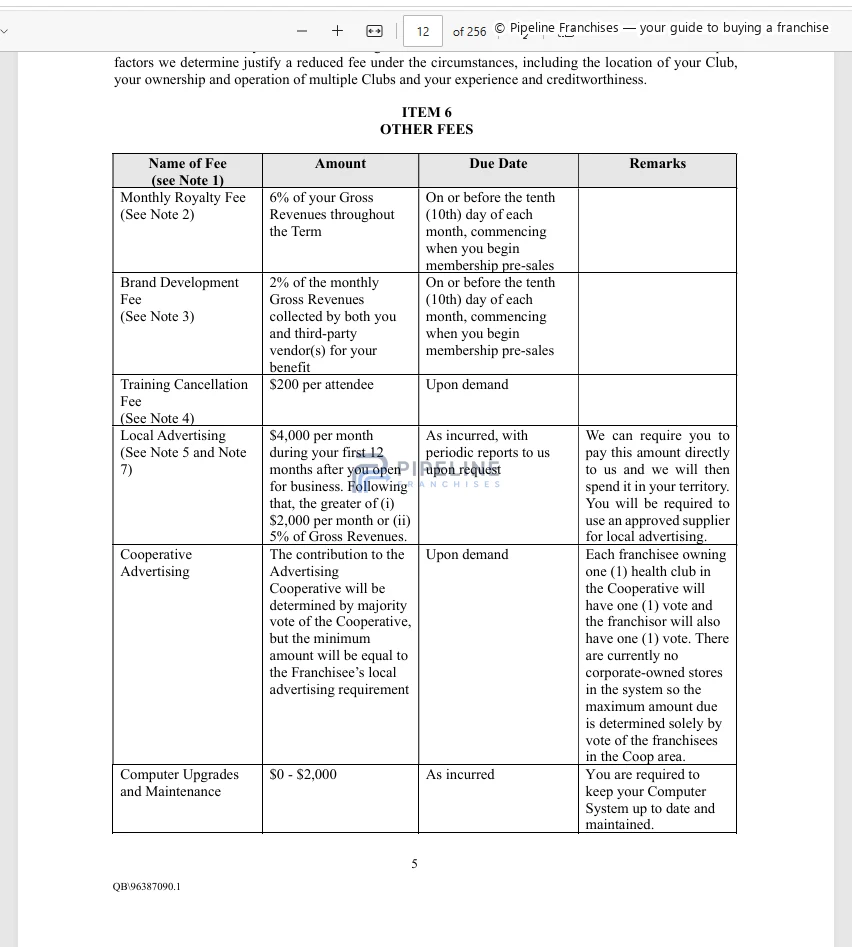
Item 7 — Estimated Initial Investment
2 images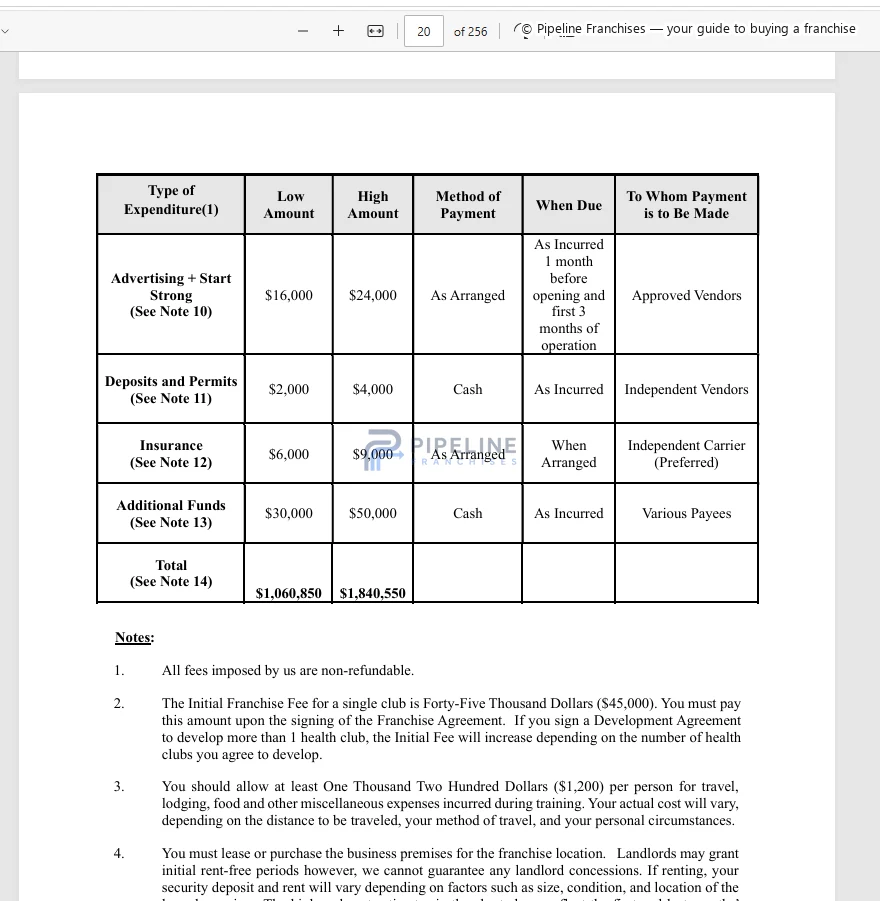
Item 12 — Territory
1 image
Item 20 — Outlets and Franchise Information
1 image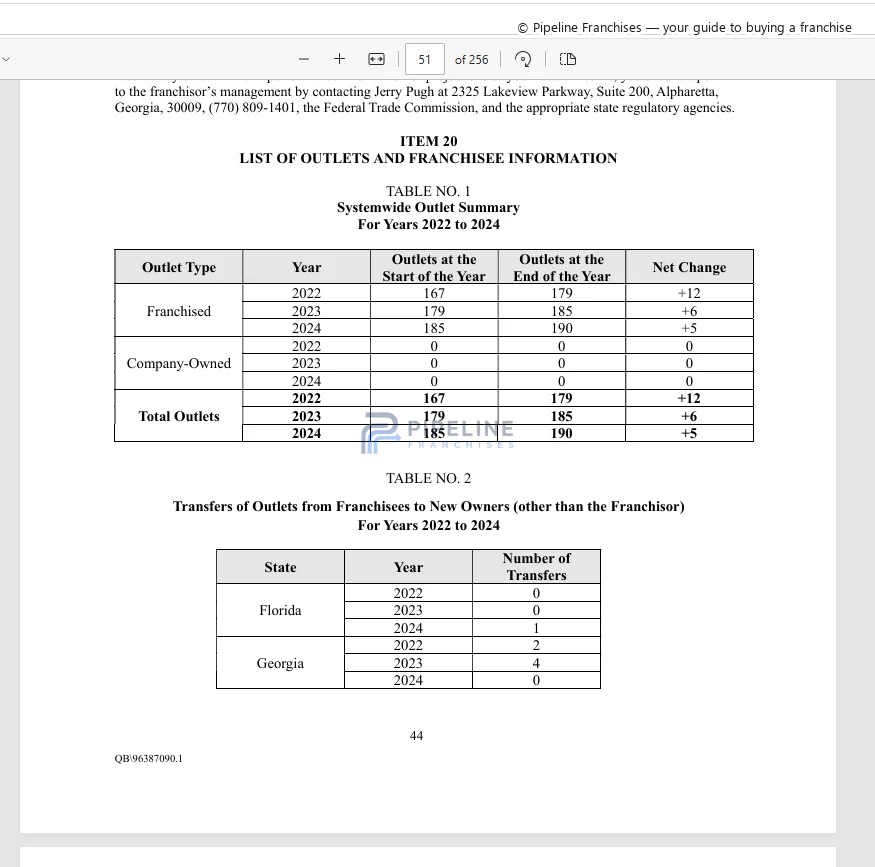
Full calculation and evidence confidence
Audit layer
Full factor ledger
Full score ledger
Every factor is classified so a displayed zero is not mistaken for a score-changing effect.
| Neutral model baseline | 70.0 |
|---|---|
| Target-market demand | Not applicable to this operating model |
| Property replacement-cycle demand | Depends on the specific site, territory, or operating condition |
| Competitive environment | Not included in the score |
| Labor and staffing friction | Measured; no meaningful local adjustment |
| Transportation, routing, and parking | Depends on the specific site, territory, or operating condition |
| Real estate and site feasibility | Not included in the score |
| Sales and customer acquisition | Not included in the score |
| Referral ecosystem | Not included in the score |
| Territory quality | -0.7 |
| Regulatory and operating friction | Depends on the specific site, territory, or operating condition |
| Full-precision calculated score | 69.27 |
| Published local-market alignment | 69.3 |
Factor calculations use full precision. Contributions and published scores are displayed to one decimal place; ranking order uses the full-precision score.
Evidence confidence
- City Modifier Evidence
- Strong
- Factor Research Coverage
- Adequate
- Franchise-profile completeness
- Limited
- Source-evidence confidence
- Adequate
- Geographic applicability
- Limited
- Overall evidence confidence
- Moderate evidence confidence
- Largest absolute effect
- Territory quality -0.7 pts
- Tested rank range
- #14–#14
No franchise concepts match the selected filters.
Worked score example
How we calculated City Wide
This example uses the same ledger shown for every concept and must reconcile exactly to the published score.
Full score ledger
Every factor is classified so a displayed zero is not mistaken for a score-changing effect.
| Neutral model baseline | 70.0 |
|---|---|
| Target-market demand | +0.4 |
| Property replacement-cycle demand | Depends on the specific site, territory, or operating condition |
| Competitive environment | Not included in the score |
| Labor and staffing friction | Measured; no meaningful local adjustment |
| Transportation, routing, and parking | Depends on the specific site, territory, or operating condition |
| Real estate and site feasibility | Not included in the score |
| Sales and customer acquisition | Not included in the score |
| Referral ecosystem | Not included in the score |
| Territory quality | -0.1 |
| Regulatory and operating friction | Depends on the specific site, territory, or operating condition |
| Full-precision calculated score | 70.40 |
| Published local-market alignment | 70.4 |
Factor calculations use full precision. Contributions and published scores are displayed to one decimal place; ranking order uses the full-precision score.
Starting pointThe operating-model baseline shown in the first ledger row.
InteractionsAny interaction or gate is included in the relevant contribution or calibration row.
Confidence treatmentEvidence confidence is disclosed separately unless the model definition explicitly applies a calibration adjustment.
RoundingFull-precision contributions are summed before the final displayed score is rounded to one decimal place; whole-number results are shown without a trailing decimal.
Factor impact
Which local conditions changed scores or rankings?
We neutralized one factor at a time, recalculated every score, and then measured both absolute score movement and changes in rank order.
Observed model effectMixed or model dependent
Target-market demand
We tested how much of the city’s theoretical customer and business demand remained usable after operating friction.
Why concepts react differently
We applied a measurable adjustment to 6 of 14 concepts. When we neutralized the factor and recalculated the table, 8 concepts changed position. HomeSmiles moved from #4 to #8, the largest movement among concepts directly affected by this factor.
Concepts adjusted6 of 14
Average among affected+0.2 pts
Average across all concepts+0.1 pts
Concepts changing rank8
What we observed
- Fort Worth Tif 4 Southside / Medical District Scale And 2024 Taxable Valueacres: 1,278; base value usd: 229,759,626; taxable value 2024 usd: 1,658,917,576; reported percent growth: 669 mixed district metrics
- Near Southside Reports Approximately 30,000 Jobs In Tarrant County’s Second Largest Employment Center And Five Major Hospitals In The Medical Districtjobs approximate: 30,000; major hospitals: 5; employment center rank in tarrant county: 2 mixed institutional metrics
Concepts helped most
City WideFacility management
+0.4 pts
Jan-Pro InternationalCommercial cleaning
+0.3 pts
FASTSIGNSSigns and graphics
+0.2 pts
HomeSmilesProperty maintenance services
+0.2 pts
Rainbow International RestorationRestoration
+0.1 pts
Observed model effectMixed or model dependent
Territory quality
We measured whether the territory structure could support the required customer density, service radius, and operating model.
Why concepts react differently
We applied a measurable adjustment to 14 of 14 concepts. When we neutralized the factor and recalculated the table, 10 concepts changed position. Workout Anytime moved from #14 to #8, the largest movement among concepts directly affected by this factor.
Concepts adjusted14 of 14
Average among affected-0.3 pts
Average across all concepts-0.3 pts
Concepts changing rank10
What we observed
- Fort Worth Grew 11.9 Percent From 2020 To 2025 And Ranked 23rd In Population Density Among The 30 Most Populous U.s. Citiespopulation change 2020 2025 percent: 11.9; density rank among top 30 cities: 23 mixed population metrics
- Near Southside Reports Approximately 30,000 Jobs In Tarrant County’s Second Largest Employment Center And Five Major Hospitals In The Medical Districtjobs approximate: 30,000; major hospitals: 5; employment center rank in tarrant county: 2 mixed institutional metrics
- Alliancetexas Developer Reported Scale In North Fort Worth Regiondevelopment acres: 27,000; companies minimum: 600; direct jobs minimum: 73,000 mixed development metrics
Concepts challenged most
Workout AnytimeFitness
-0.7 pts
FASTSIGNSSigns and graphics
-0.4 pts
ZOOM DRAINDrain and sewer service
-0.4 pts
Mr. RooterPlumbing
-0.4 pts
PuroCleanRestoration
-0.4 pts
Measured but not differentiating in this concept set
- Property replacement-cycle demandNo material score adjustment
- Competitive environmentNo material score adjustment
- Labor and staffing frictionNo material score adjustment
- Transportation, routing, and parkingNo material score adjustment
- Real estate and site feasibilityNo material score adjustment
- Sales and customer acquisitionNo material score adjustment
- Referral ecosystemNo material score adjustment
- Regulatory and operating frictionNo material score adjustment
Rank stability
Which positions depend most on individual assumptions?
The line shows the best and worst rank reached when one factor was removed from every concept. A narrow range indicates a more stable position.
#1 City WideStable · tested #1–#1
#2 Jan-Pro InternationalModerately sensitive · tested #2–#4
#3 ActionCOACHHighly sensitive · tested #2–#6
#4 HomeSmilesModerately sensitive · tested #4–#7
#5 Tiger AdjustersHighly sensitive · tested #3–#8
#6 FASTSIGNSHighly sensitive · tested #3–#13
#7 Pillar To Post Home InspectorsHighly sensitive · tested #5–#12
#8 Rainbow International RestorationHighly sensitive · tested #5–#9
#9 Aire ServModerately sensitive · tested #6–#9
#10 Mister Sparky ElectricModerately sensitive · tested #8–#11
#11 PuroCleanModerately sensitive · tested #10–#13
#12 Mr. RooterModerately sensitive · tested #10–#12
#13 ZOOM DRAINHighly sensitive · tested #9–#13
#14 Workout AnytimeStable · tested #14–#14
Neutralizing a factor removes it from every concept. A concept can move down even when its own score improves because competitors may benefit more.
Original factor comparison
How each factor affected the highest-rated franchise concepts
The graph includes the top 14 concepts by local-alignment score. Only nonzero score contributions are plotted. A factor is removed when every displayed concept received 0.0 points from it. Hover or focus a concept name to highlight all of its remaining data points.
Primary source records by factorTarget-market demand: [7] [8] [12] [11] [27] [28] [25] [4] [6]Property replacement-cycle demand: [7] [14] [15] [16] [17] [4]Competitive environment: [8] [12] [13] [6]Labor and staffing friction: [9] [10] [11] [12] [25] [4] [5]Transportation, routing, and parking: [22] [23] [6] [5]Real estate and site feasibility: [24] [26] [25] [19] [20] [21] [4] [6]Sales and customer acquisition: [8] [12] [13] [29] [30] [6]Referral ecosystem: [27] [28] [29] [30] [6]Territory quality: [8] [25] [27] [28] [24] [23] [4] [6]Regulatory and operating friction: [20] [21] [18] [19] [22] [29] [30] [5] [6]
View the chart data as a table
| Concept | Target-market demand | Territory quality |
|---|---|---|
| #1 City Wide | +0.4 pts | -0.1 pts |
| #2 Jan-Pro International | +0.3 pts | -0.3 pts |
| #3 ActionCOACH | +0.1 pts | -0.1 pts |
| #4 HomeSmiles | +0.2 pts | -0.3 pts |
| #5 Tiger Adjusters | — | -0.2 pts |
| #6 FASTSIGNS | +0.2 pts | -0.4 pts |
| #7 Pillar To Post Home Inspectors | — | -0.3 pts |
| #8 Rainbow International Restoration | +0.1 pts | -0.4 pts |
| #9 Aire Serv | — | -0.3 pts |
| #10 Mister Sparky Electric | — | -0.4 pts |
| #11 PuroClean | — | -0.4 pts |
| #12 Mr. Rooter | — | -0.4 pts |
| #13 ZOOM DRAIN | — | -0.4 pts |
| #14 Workout Anytime | — | -0.7 pts |
Interpretation
How to interpret the result
City Wide, Jan-Pro International, ActionCOACH led because their operating requirements captured more of the local support from target-market demand while remaining less exposed to territory quality. The same city condition can help one operating model and constrain another, so score differences should be read through each concept's factor pattern rather than as a universal franchise-quality verdict. The ordering is most assumption-sensitive for ActionCOACH, Tiger Adjusters, FASTSIGNS; their ranks move more widely when individual factors are neutralized.
Local evidence assessed for modeling
Category comparisons
Best franchise categories we assessed in Fort Worth, Texas
Category summaries are shown only when at least two concepts qualified. Two-concept comparisons are explicitly labeled as limited.
Limited two-concept comparison
69.7Best Restoration franchise opportunities we assessed in Fort Worth, Texas
2 Restoration concepts qualified for comparison, with scores ranging from 69.6 to 69.7. Rainbow International Restoration ranked highest at 69.7. Territory quality reduced the exposed concepts by 0.4 points on average.
Interpret cautiously: A 0.1-point spread is too small to support a strong brand-level conclusion from city alignment alone.
- Concepts compared
- 2
- Score range
- 69.6–69.7
- Category average
- 69.7
Rainbow International Restoration69.7
PuroClean69.6
Metric registry
The 21 local metrics behind this analysis
The registry shows each public metric’s raw value, period, geography, source, and its actual role in the compiled analysis.
View all local metrics
| Metric | Raw value | Period | Geography | Role in analysis | Source |
|---|---|---|---|---|---|
| Resident population estimate on July 1, 2025 | 1,028,117people | July 1, 2025 population estimate; 2020-2024 ACS household and housing measures | Fort Worth, Texas | Supports research conclusion | [7] [8] |
| Fort Worth grew 11.9 percent from 2020 to 2025 and ranked 23rd in population density among the 30 most populous U.S. cities | population change 2020 2025 percent: 11.9; density rank among top 30 cities: 23mixed population metrics | U.S. Census Bureau Vintage 2025 population estimates summarized by the City | Fort Worth, Texas | Used in scoring | [8] [7] |
| Fort Worth household count and owner-occupied housing rate, 2020-2024 | households: 342,126; owner occupied housing unit rate percent: 57mixed household metrics | July 1, 2025 population estimate; 2020-2024 ACS household and housing measures | Fort Worth, Texas | Context only | [7] |
| Tarrant County covered establishments, employment, and average weekly wage in fourth quarter 2025 | establishments thousands: 49.8; employment thousands: 1,029.8; average weekly wage usd: 1,493; employment change yoy percent: 0.2mixed business labor metrics | Fourth quarter 2025 | Tarrant County, Texas | Context only | [12] |
| Selected Dallas-Fort Worth major occupational-group mean hourly wages compared with U.S. averages in May 2024 | food preparation and serving dallas: 15.69; food preparation and serving us: 17.32; building and grounds dallas: 17.48; building and grounds us: 19.01; construction and extraction dallas: 26.49; construction and extraction us: 30.73; installation maintenance repair dallas: 28.97; installation maintenance repair us: 29.63; additional values omittedusd per hour and percent | May 2024 | Dallas-Fort Worth-Arlington, Texas MSA | Context only | [9] |
| Private-industry compensation and wages-and-salaries changes in the Dallas-Fort Worth compensation locality for the year ending March 2026 | total compensation change percent: 2.3; wages and salaries change percent: 1.8; us total compensation change percent: 3.4; us wages and salaries change percent: 3.4percent change | 12 months ending March 2026 | Dallas-Fort Worth, TX-OK CSA compensation locality | Context only | [10] |
| Fort Worth-Arlington-Grapevine total nonfarm employment in June 2026 and preliminary May 2026 unemployment rate | total nonfarm employment thousands june 2026: 1,224.7; total nonfarm yoy change percent june 2026: 1.3; unemployment rate percent may 2026 preliminary: 4mixed labor metrics | Labor force through May 2026; nonfarm employment through June 2026, preliminary where marked | Fort Worth-Arlington-Grapevine, Texas | Context only | [11] |
| City geographic descriptions document substantial clay soils in both southwest and north Fort Worth | southwest fort worth: shallow clay over dense calcareous limestone mixed with areas of dense black clay; north fort worth: largely shallow clay with dense plates of calcareous limestone beneathqualitative soil distribution | Current city geographic description accessed August 2026 | Southwest and North Fort Worth, Texas | Conditional relationship | [14] [15] |
| Ponder soil series type location in Fort Worth has documented shrink-swell indicators | cole upper argillic horizon min: 0.08; cole upper argillic horizon max: 0.11; gilgai: weakly expressedcole and qualitative | Current Official Series Description accessed August 2026 | Fort Worth, Tarrant County, Texas | Conditional relationship | [16] [17] |
| Fort Worth water and wastewater impact fees for selected commercial meter sizes under current and October 2026 schedules | current oct 2025 to sep 2026: 1 inch combined usd: 13,760, 1 5 inch combined usd: 27,520, 2 inch combined usd: 44,032; effective oct 1 2026: 1 inch combined usd: 14,570, 1 5 inch combined usd: 29,140, 2 inch combined usd: 46,624; card service fee percent for certain development and permitting services: 2.5usd and percent | Rates adopted June 10, 2025; schedules effective October 1, 2025 and October 1, 2026 | Qualifying Fort Worth development within the water/wastewater impact-fee framework | Context only | [18] [19] |
| Current Fort Worth impact-fee schedule is gated by plat date, building-permit date, and meter size | plat recorded on or after: 2017-04-01; current schedule building permit on or after: 2025-10-01; next schedule building permit on or after: 2026-10-01; fee basis: water meter size and equivalency factorregulatory conditions | Current schedule October 1, 2025-September 30, 2026; next schedule effective October 1, 2026 | Qualifying Fort Worth development | Context only | [19] |
| Exterior alterations in Fort Worth urban design districts require Certificate of Appropriateness review, including covered signage and awning work | certificate required for exterior alterations: yes; covered examples: permanent signs, banners, window signs, temporary signs, awnings, canopiescategorical requirement | Current rules accessed August 2026 | Fort Worth urban design districts and overlays | Conditional relationship | [20] |
| Exterior changes to designated historic properties require a Certificate of Appropriateness before permits or construction | yesboolean requirement | Current rules accessed August 2026 | Designated historic properties and districts in Fort Worth | Conditional relationship | [21] |
| Fort Worth commercial loading zones are restricted to clearly marked commercial delivery vehicles; non-commercial delivery vehicles require a permit | six month permit usd: 75; annual permit usd: 150; one vehicle per permit: yes; insurance certificate required: yes; permit trigger: non-commercial vehicle used for deliveries in a commercial loading zonerule and fee | Current rules and fees accessed August 2026 | Fort Worth commercial loading zones | Conditional relationship | [22] |
| Fort Worth listed multiple roadway restrictions active on August 7, 2026 with end dates extending into late 2026 or 2027 | road: Camp Bowie Boulevard, limits: Irene Dr to Floyd Dr, start: 2026-07-27, end: 2026-10-01, type: Various, road: Alton Road, limits: W Biddison to South Hills Ave, start: 2026-03-31, end: 2027-03-01, type: Full, road: Commerce Street, limits: 4th St to 5th St, start: 2026-06-23, end: 2026-09-30, type: Sidewalk and Lane, road: W. 7th Street, limits: University Dr to Norwood St, start: 2025-02-11, end: 2027-03-31, type: Various, road: N. Main Street, limits: NW 28th St to NW 14th St, start: 2026-07-21, end: 2026-12-25, type: Variousactive roadway restrictions | Active and scheduled roadway restrictions displayed August 7, 2026 | Fort Worth, Texas | Conditional relationship | [23] |
| Dallas-Fort Worth industrial conditions in Q2 2026 | overall vacancy percent: 8.1; asking rent net usd per sf: 9.19; quarterly leasing million sf: 20.5; alliance ytd net absorption million sf: 3.9; south fort worth ytd net absorption million sf: 1.8; only size segment above 10 percent vacancy: 150,000-499,999 sfmixed cre metrics | Second quarter 2026 | Dallas-Fort Worth industrial market with Fort Worth submarket detail | Context only | [24] |
| AllianceTexas developer-reported scale in north Fort Worth region | development acres: 27,000; companies minimum: 600; direct jobs minimum: 73,000mixed development metrics | Current development profile accessed August 2026 | AllianceTexas, north Fort Worth region | Used in scoring | [25] |
| AllianceTexas developer markets office and flex-space solutions and a current availability portal | office and flex solutions marketed: yes; availability portal offered: yescategorical | Current availability marketing accessed August 2026 | AllianceTexas, north Fort Worth region | Context only | [26] |
| Near Southside reports approximately 30,000 jobs in Tarrant County’s second-largest employment center and five major hospitals in the Medical District | jobs approximate: 30,000; major hospitals: 5; employment center rank in tarrant county: 2mixed institutional metrics | Current neighborhood organization profile accessed August 2026 | Near Southside / Medical District, Fort Worth | Used in scoring | [27] |
| Fort Worth TIF 4 Southside / Medical District scale and 2024 taxable value | acres: 1,278; base value usd: 229,759,626; taxable value 2024 usd: 1,658,917,576; reported percent growth: 669mixed district metrics | 2024 taxable values and current TIF descriptions accessed August 2026 | TIF 4 Southside / Medical District, Fort Worth | Used in scoring | [28] |
| City of Fort Worth supplier participation requires PeopleSoft registration and uses Bonfire for procurements posted on or after January 1, 2024 | peoplesoft supplier registration required: yes; bonfire for procurements posted on or after: 2024-01-01; sbe bid preference percent up to 100k: 5; sbe utilization target percent over 100k: 30procurement conditions | Current procurement registration process accessed August 2026 | City of Fort Worth | Context only | [29] [30] |
How to use the ranking
What the model can and cannot establish
- Scores measure local operating alignment, not expected financial performance or franchise-system quality.
- Citywide evidence may not describe the exact site or territory ultimately offered.
- Conditional effects are shown for diligence but do not change the published score until their applicability is established.
Methodology
How the local-alignment ranking is calculated
Measure the city
Collect reusable local metrics with source, period, geography, and confidence fields.
Profile each operating model
Map each franchise to controlled operating attributes and local sensitivities.
Apply scoreable effects
Score only effects whose applicability is established at the report’s current geographic and operating scope.
Preserve conditional effects
Keep location- or territory-dependent issues visible for diligence without automatically changing the score.
Test rank sensitivity
Remove one factor at a time from every concept and rerank using full-precision scores.
Generate public output
Create the ranking, factor-status ledger, visuals, metric registry, and automated quality report from the same data.
How the common baseline becomes a city-specific score
Every concept starts from the same 70.0 reference point, so differences come only from modeled local interactions. In this city, City Wide reached 70.40 after target-market demand +0.4 pts and territory quality -0.1 pts. The current model caps total local movement at ±18.0 points. The score is not a percentage, probability, or estimate of investment quality.
Precision and materiality
Calculations use full-precision values. Published scores and factor contributions display one decimal place, while ranks use full precision. Effects smaller than 0.1 points are identified as below the publication threshold rather than presented as a meaningful zero.
Score tiers
Tier 1 · Strongest modeled alignment80.0–100.0
Tier 2 · Favorable modeled alignment72.0–<80.0
Tier 3 · Mixed modeled alignment64.0–<72.0
Tier 4 · Higher-friction modeled alignment0.0–<64.0
How factor rows are classified
Positive local adjustmentNegative local adjustmentMeasured; no meaningful local adjustmentEffect below the publication thresholdNot applicable to this operating modelDepends on the specific site, territory, or operating conditionNot included in the score
What “best” means here
“Best” means the strongest modeled local operating alignment among the franchise concepts assessed on this page.
Model governance
How this report is calculated and corrected
Calculation controls
- Model designer
- Thomas Jepsen
No concept’s final score is manually raised or lowered after calculation. Before this template is activated, the report is reviewed for source scope, classification, arithmetic, unsupported claims, duplication, and readability.
Model history
- Model 0.9.0-calibration · August 19, 2026Added compiler-derived decision intelligence and observation usage mapping., Changed factor sensitivity and channel counterfactuals to full model reruns., Added data-dependent city content signals while preserving legacy public report fields., and Added model-owned semantic compatibility gates and backward-compatible channel-level evidence attribution.
Corrections policy
Corrected source, geography, or operating-profile evidence triggers a full compiler rerun so every dependent score and visual is recalculated.
Source registry
Evidence represented in this report
Each source identifies its period, scope, and the claims or metrics it supports. Internal or supplied research is clearly distinguished from publicly accessible evidence.
- 1Franchise-to-city operating-fit model definitionInternal or supplied research; not publicly accessible.
- 2Valid city JSON exampleInternal or supplied research; not publicly accessible.
- 3Compiler-ready city research JSON instructionsInternal or supplied research; not publicly accessible.
- 4Supplied multi-city structural franchise research docketInternal or supplied research; not publicly accessible.
- 5Forensic Audit of Municipal Structural Constraints: Cross-Jurisdictional Barrier AnalysisInternal or supplied research; not publicly accessible.
- 6Franchise data - remake - Combine2 neighborhood research tableInternal or supplied research; not publicly accessible.
- 7QuickFacts: Fort Worth city, Texas
Used for: Resident population estimate on July 1, 2025, Fort Worth grew 11.9 percent from 2020 to 2025 and ranked 23rd in population density among the 30 most populous U.S. cities, and Fort Worth household count and owner-occupied housing rate, 2020-2024
- 8Population
Used for: Resident population estimate on July 1, 2025 and Fort Worth grew 11.9 percent from 2020 to 2025 and ranked 23rd in population density among the 30 most populous U.S. cities
- 9Occupational Employment and Wages in Dallas-Fort Worth-Arlington — May 2024
Used for: Selected Dallas-Fort Worth major occupational-group mean hourly wages compared with U.S. averages in May 2024
- 10Changing Compensation Costs in the Dallas Metropolitan Area — March 2026
Used for: Private-industry compensation and wages-and-salaries changes in the Dallas-Fort Worth compensation locality for the year ending March 2026
- 11Fort Worth-Arlington, TX Economy at a Glance
Used for: Fort Worth-Arlington-Grapevine total nonfarm employment in June 2026 and preliminary May 2026 unemployment rate
- 12County Employment and Wages in Texas — Fourth Quarter 2025
Used for: Tarrant County covered establishments, employment, and average weekly wage in fourth quarter 2025
- 13
- 14Southwest Fort Worth
Used for: City geographic descriptions document substantial clay soils in both southwest and north Fort Worth
- 15North Fort Worth
Used for: City geographic descriptions document substantial clay soils in both southwest and north Fort Worth
- 16Official Series Description — Ponder Series
Used for: Ponder soil series type location in Fort Worth has documented shrink-swell indicators
- 17Geotechnical Manual: Interpretation of Soil Data — Disregard Depth
Used for: Ponder soil series type location in Fort Worth has documented shrink-swell indicators
- 18Water and Wastewater Impact Fees
Used for: Fort Worth water and wastewater impact fees for selected commercial meter sizes under current and October 2026 schedules
- 19Current Impact Fees
Used for: Fort Worth water and wastewater impact fees for selected commercial meter sizes under current and October 2026 schedules and Current Fort Worth impact-fee schedule is gated by plat date, building-permit date, and meter size
- 20Urban Design Districts and Overlays
Used for: Exterior alterations in Fort Worth urban design districts require Certificate of Appropriateness review, including covered signage and awning work
- 21Historic Preservation
Used for: Exterior changes to designated historic properties require a Certificate of Appropriateness before permits or construction
- 22Commercial Loading Zone Permits
Used for: Fort Worth commercial loading zones are restricted to clearly marked commercial delivery vehicles; non-commercial delivery vehicles require a permit
- 23Road Closures
Used for: Fort Worth listed multiple roadway restrictions active on August 7, 2026 with end dates extending into late 2026 or 2027
- 24Dallas/Fort Worth Industrial MarketBeat — Q2 2026
Used for: Dallas-Fort Worth industrial conditions in Q2 2026
- 25Industrial | AllianceTexas | Fort Worth, TX
Used for: AllianceTexas developer-reported scale in north Fort Worth region
- 26Office | AllianceTexas | Fort Worth, TX
Used for: AllianceTexas developer markets office and flex-space solutions and a current availability portal
- 27Near Southside, Inc. — Near Southside Today
Used for: Near Southside reports approximately 30,000 jobs in Tarrant County’s second-largest employment center and five major hospitals in the Medical District
- 28Tax Increment Financing Districts (TIFs)
Used for: Fort Worth TIF 4 Southside / Medical District scale and 2024 taxable value
- 29City of Fort Worth Supplier Information
Used for: City of Fort Worth supplier participation requires PeopleSoft registration and uses Bonfire for procurements posted on or after January 1, 2024
- 30Small Business Enterprise Certification (SBE)
Used for: City of Fort Worth supplier participation requires PeopleSoft registration and uses Bonfire for procurements posted on or after January 1, 2024
Before contacting a franchisor
Complete the next layer of due diligence
- Confirm the exact protected territory and neighboring units.
- Review the current Franchise Disclosure Document.
- Validate local staffing, licensing, insurance, and service-base assumptions.
- Obtain location, vehicle, buildout, or working-capital estimates.
- Speak with current and former franchisees.
- Build a candidate-specific financial scenario.
Apply the analysis to your situation
Review how these market findings apply to your budget, role, and proposed territory.
The city score does not include your experience, capital structure, time commitment, financing, or exact territory.
Disclaimer and broker disclosure: This analysis is informational and does not constitute financial, legal, accounting, or investment advice. Market-alignment scores do not predict financial performance or business success. Offers are made only through the delivery of a Franchise Disclosure Document. We may receive referral compensation from participating franchisors; compensation is not an input to the scoring model.